Sierra Leonean vs Zimbabwean Master's Degree

COMPARE

Sierra Leonean
Race
Ancestry
AfghanAfricanAlaska NativeAlaskan AthabascanAlbanianAleutAlsatianAmericanApacheArabArapahoArgentineanArmenianAssyrian/Chaldean/SyriacAustralianAustrianBahamianBangladeshiBarbadianBasqueBelgianBelizeanBermudanBhutaneseBlackfeetBolivianBrazilianBritishBritish West IndianBulgarianBurmeseCajunCambodianCanadianCape VerdeanCarpatho RusynCelticCentral AmericanCentral American IndianCherokeeCheyenneChickasawChileanChineseChippewaChoctawColombianColvilleComancheCosta RicanCreeCreekCroatianCrowCubanCypriotCzechCzechoslovakianDanishDelawareDominicanDutchDutch West IndianEastern EuropeanEcuadorianEgyptianEnglishEstonianEthiopianEuropeanFijianFilipinoFinnishFrenchFrench American IndianFrench CanadianGermanGerman RussianGhanaianGreekGuamanian/ChamorroGuatemalanGuyaneseHaitianHmongHonduranHopiHoumaHungarianIcelanderIndian (Asian)IndonesianInupiatIranianIraqiIrishIroquoisIsraeliItalianJamaicanJapaneseJordanianKenyanKiowaKoreanLaotianLatvianLebaneseLiberianLithuanianLumbeeLuxembourgerMacedonianMalaysianMalteseMarshalleseMenomineeMexicanMexican American IndianMongolianMoroccanNative HawaiianNavajoNepaleseNew ZealanderNicaraguanNigerianNorthern EuropeanNorwegianOkinawanOsageOttawaPaiutePakistaniPalestinianPanamanianParaguayanPennsylvania GermanPeruvianPimaPolishPortuguesePotawatomiPuebloPuerto RicanPuget Sound SalishRomanianRussianSalvadoranSamoanScandinavianScotch-IrishScottishSeminoleSenegaleseSerbianShoshoneSierra LeoneanSiouxSlavicSlovakSloveneSomaliSouth AfricanSouth AmericanSouth American IndianSoviet UnionSpaniardSpanishSpanish AmericanSpanish American IndianSri LankanSubsaharan AfricanSudaneseSwedishSwissSyrianTaiwaneseThaiTlingit-HaidaTohono O'OdhamTonganTrinidadian and TobagonianTsimshianTurkishU.S. Virgin IslanderUgandanUkrainianUruguayanUteVenezuelanVietnameseWelshWest IndianYakamaYaquiYugoslavianYumanYup'ik
Immigration
NonimmigrantsImmigrantsAfghanistanAfricaAlbaniaArgentinaArmeniaAsiaAustraliaAustriaBahamasBangladeshBarbadosBelarusBelgiumBelizeBoliviaBosnia and HerzegovinaBrazilBulgariaBurma/MyanmarCabo VerdeCambodiaCameroonCanadaCaribbeanCentral AmericaChileChinaColombiaCongoCosta RicaCroatiaCubaCzechoslovakiaDenmarkDominicaDominican RepublicEastern AfricaEastern AsiaEastern EuropeEcuadorEgyptEl SalvadorEnglandEritreaEthiopiaEuropeFijiFranceGermanyGhanaGreeceGrenadaGuatemalaGuyanaHaitiHondurasHong KongHungaryIndiaIndonesiaIranIraqIrelandIsraelItalyJamaicaJapanJordanKazakhstanKenyaKoreaKuwaitLaosLatin AmericaLatviaLebanonLiberiaLithuaniaMalaysiaMexicoMicronesiaMiddle AfricaMoldovaMoroccoNepalNetherlandsNicaraguaNigeriaNorth AmericaNorth MacedoniaNorthern AfricaNorthern EuropeNorwayOceaniaPakistanPanamaPeruPhilippinesPolandPortugalRomaniaRussiaSaudi ArabiaScotlandSenegalSerbiaSierra LeoneSingaporeSomaliaSouth AfricaSouth AmericaSouth Central AsiaSouth Eastern AsiaSouthern EuropeSpainSri LankaSt. Vincent and the GrenadinesSudanSwedenSwitzerlandSyriaTaiwanThailandTrinidad and TobagoTurkeyUgandaUkraineUruguayUzbekistanVenezuelaVietnamWest IndiesWestern AfricaWestern AsiaWestern EuropeYemenZaireZimbabweAzores
Zimbabwean
Race
Ancestry
AfghanAfricanAlaska NativeAlaskan AthabascanAlbanianAleutAlsatianAmericanApacheArabArapahoArgentineanArmenianAssyrian/Chaldean/SyriacAustralianAustrianBahamianBangladeshiBarbadianBasqueBelgianBelizeanBermudanBhutaneseBlackfeetBolivianBrazilianBritishBritish West IndianBulgarianBurmeseCajunCambodianCanadianCape VerdeanCarpatho RusynCelticCentral AmericanCentral American IndianCherokeeCheyenneChickasawChileanChineseChippewaChoctawColombianColvilleComancheCosta RicanCreeCreekCroatianCrowCubanCypriotCzechCzechoslovakianDanishDelawareDominicanDutchDutch West IndianEastern EuropeanEcuadorianEgyptianEnglishEstonianEthiopianEuropeanFijianFilipinoFinnishFrenchFrench American IndianFrench CanadianGermanGerman RussianGhanaianGreekGuamanian/ChamorroGuatemalanGuyaneseHaitianHmongHonduranHopiHoumaHungarianIcelanderIndian (Asian)IndonesianInupiatIranianIraqiIrishIroquoisIsraeliItalianJamaicanJapaneseJordanianKenyanKiowaKoreanLaotianLatvianLebaneseLiberianLithuanianLumbeeLuxembourgerMacedonianMalaysianMalteseMarshalleseMenomineeMexicanMexican American IndianMongolianMoroccanNative HawaiianNavajoNepaleseNew ZealanderNicaraguanNigerianNorthern EuropeanNorwegianOkinawanOsageOttawaPaiutePakistaniPalestinianPanamanianParaguayanPennsylvania GermanPeruvianPimaPolishPortuguesePotawatomiPuebloPuerto RicanPuget Sound SalishRomanianRussianSalvadoranSamoanScandinavianScotch-IrishScottishSeminoleSenegaleseSerbianShoshoneSiouxSlavicSlovakSloveneSomaliSouth AfricanSouth AmericanSouth American IndianSoviet UnionSpaniardSpanishSpanish AmericanSpanish American IndianSri LankanSubsaharan AfricanSudaneseSwedishSwissSyrianTaiwaneseThaiTlingit-HaidaTohono O'OdhamTonganTrinidadian and TobagonianTsimshianTurkishU.S. Virgin IslanderUgandanUkrainianUruguayanUteVenezuelanVietnameseWelshWest IndianYakamaYaquiYugoslavianYumanYup'ikZimbabwean
Immigration
NonimmigrantsImmigrantsAfghanistanAfricaAlbaniaArgentinaArmeniaAsiaAustraliaAustriaBahamasBangladeshBarbadosBelarusBelgiumBelizeBoliviaBosnia and HerzegovinaBrazilBulgariaBurma/MyanmarCabo VerdeCambodiaCameroonCanadaCaribbeanCentral AmericaChileChinaColombiaCongoCosta RicaCroatiaCubaCzechoslovakiaDenmarkDominicaDominican RepublicEastern AfricaEastern AsiaEastern EuropeEcuadorEgyptEl SalvadorEnglandEritreaEthiopiaEuropeFijiFranceGermanyGhanaGreeceGrenadaGuatemalaGuyanaHaitiHondurasHong KongHungaryIndiaIndonesiaIranIraqIrelandIsraelItalyJamaicaJapanJordanKazakhstanKenyaKoreaKuwaitLaosLatin AmericaLatviaLebanonLiberiaLithuaniaMalaysiaMexicoMicronesiaMiddle AfricaMoldovaMoroccoNepalNetherlandsNicaraguaNigeriaNorth AmericaNorth MacedoniaNorthern AfricaNorthern EuropeNorwayOceaniaPakistanPanamaPeruPhilippinesPolandPortugalRomaniaRussiaSaudi ArabiaScotlandSenegalSerbiaSierra LeoneSingaporeSomaliaSouth AfricaSouth AmericaSouth Central AsiaSouth Eastern AsiaSouthern EuropeSpainSri LankaSt. Vincent and the GrenadinesSudanSwedenSwitzerlandSyriaTaiwanThailandTrinidad and TobagoTurkeyUgandaUkraineUruguayUzbekistanVenezuelaVietnamWest IndiesWestern AfricaWestern AsiaWestern EuropeYemenZaireZimbabweAzores
Master's Degree
Income
Poverty
Unemployment
Labor Participation
Family Structure
Vehicle Availability
Education Level
Disability

Master's Degree Comparison

Sierra Leoneans

Zimbabweans

Exceptional
Exceptional
16.8%
MASTER'S DEGREE
98.0/ 100
METRIC RATING
108th/ 347
METRIC RANK
17.7%
MASTER'S DEGREE
99.7/ 100
METRIC RATING
73rd/ 347
METRIC RANK

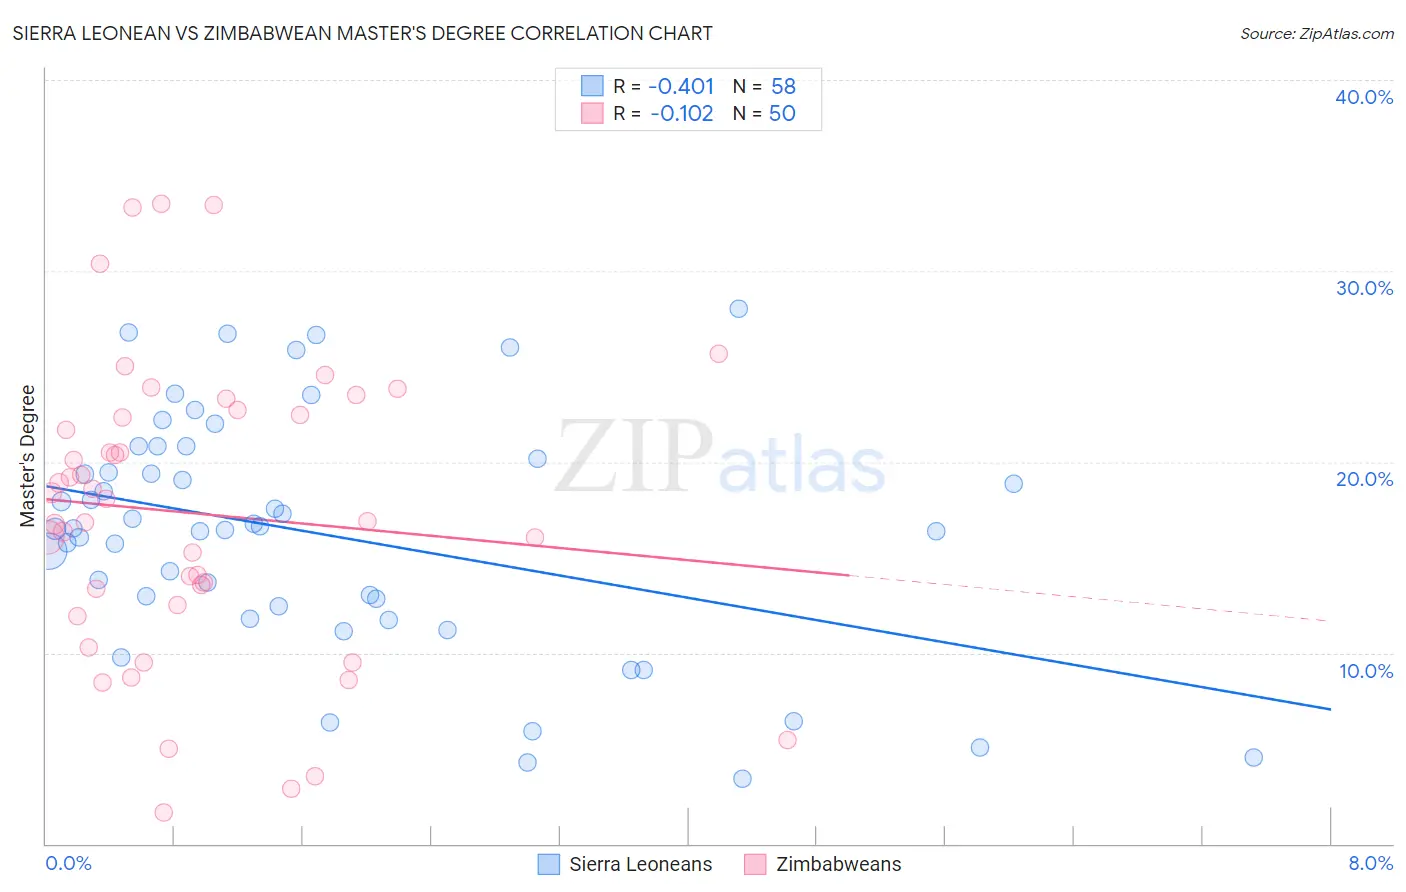
Sierra Leonean vs Zimbabwean Master's Degree Correlation Chart

The statistical analysis conducted on geographies consisting of 83,347,079 people shows a moderate negative correlation between the proportion of Sierra Leoneans and percentage of population with at least master's degree education in the United States with a correlation coefficient (R) of -0.401 and weighted average of 16.8%. Similarly, the statistical analysis conducted on geographies consisting of 69,201,212 people shows a poor negative correlation between the proportion of Zimbabweans and percentage of population with at least master's degree education in the United States with a correlation coefficient (R) of -0.102 and weighted average of 17.7%, a difference of 5.6%.
Sierra Leonean vs Zimbabwean Master's Degree

Master's Degree Correlation Summary

MeasurementSierra LeoneanZimbabwean
Minimum3.4%1.7%
Maximum28.0%33.5%
Range24.6%31.8%
Mean16.2%17.3%
Median16.5%17.5%
Interquartile 25% (IQ1)12.5%12.5%
Interquartile 75% (IQ3)20.2%22.4%
Interquartile Range (IQR)7.7%9.9%
Standard Deviation (Sample)6.2%7.7%
Standard Deviation (Population)6.1%7.6%

Similar Demographics by Master's Degree

Demographics Similar to Sierra Leoneans by Master's Degree

In terms of master's degree, the demographic groups most similar to Sierra Leoneans are Moroccan (16.8%, a difference of 0.020%), Armenian (16.8%, a difference of 0.030%), Immigrants from Chile (16.8%, a difference of 0.050%), Immigrants from Albania (16.8%, a difference of 0.12%), and Austrian (16.7%, a difference of 0.32%).
DemographicsRating | RankMaster's Degree
Immigrants | Nepal
98.6
/100
|
#101
Exceptional
17.0%
Chileans
98.6
/100
|
#102
Exceptional
16.9%
Alsatians
98.4
/100
|
#103
Exceptional
16.9%
Ukrainians
98.3
/100
|
#104
Exceptional
16.9%
Syrians
98.3
/100
|
#105
Exceptional
16.8%
Immigrants | Albania
98.1
/100
|
#106
Exceptional
16.8%
Armenians
98.0
/100
|
#107
Exceptional
16.8%
Sierra Leoneans
98.0
/100
|
#108
Exceptional
16.8%
Moroccans
98.0
/100
|
#109
Exceptional
16.8%
Immigrants | Chile
98.0
/100
|
#110
Exceptional
16.8%
Austrians
97.8
/100
|
#111
Exceptional
16.7%
Macedonians
97.7
/100
|
#112
Exceptional
16.7%
Arabs
97.7
/100
|
#113
Exceptional
16.7%
Northern Europeans
97.6
/100
|
#114
Exceptional
16.7%
Immigrants | Uganda
97.3
/100
|
#115
Exceptional
16.6%

Demographics Similar to Zimbabweans by Master's Degree

In terms of master's degree, the demographic groups most similar to Zimbabweans are Lithuanian (17.7%, a difference of 0.11%), Immigrants from Pakistan (17.8%, a difference of 0.28%), Immigrants from Romania (17.7%, a difference of 0.31%), Immigrants from Western Europe (17.8%, a difference of 0.57%), and Egyptian (17.6%, a difference of 0.69%).
DemographicsRating | RankMaster's Degree
Ethiopians
99.8
/100
|
#66
Exceptional
18.0%
Immigrants | Argentina
99.8
/100
|
#67
Exceptional
18.0%
Immigrants | Ethiopia
99.8
/100
|
#68
Exceptional
17.9%
Immigrants | Uzbekistan
99.8
/100
|
#69
Exceptional
17.9%
Immigrants | Western Europe
99.8
/100
|
#70
Exceptional
17.8%
Immigrants | Pakistan
99.7
/100
|
#71
Exceptional
17.8%
Lithuanians
99.7
/100
|
#72
Exceptional
17.7%
Zimbabweans
99.7
/100
|
#73
Exceptional
17.7%
Immigrants | Romania
99.7
/100
|
#74
Exceptional
17.7%
Egyptians
99.6
/100
|
#75
Exceptional
17.6%
Immigrants | Indonesia
99.6
/100
|
#76
Exceptional
17.6%
Immigrants | Eastern Europe
99.6
/100
|
#77
Exceptional
17.6%
Immigrants | Hungary
99.6
/100
|
#78
Exceptional
17.5%
Immigrants | Lebanon
99.6
/100
|
#79
Exceptional
17.5%
Carpatho Rusyns
99.6
/100
|
#80
Exceptional
17.5%