Serbian vs Immigrants from Greece 2 or more Vehicles in Household
COMPARE
Serbian
Immigrants from Greece
2 or more Vehicles in Household
2 or more Vehicles in Household Comparison
Serbians
Immigrants from Greece
56.1%
2 OR MORE VEHICLES IN HOUSEHOLD
80.3/ 100
METRIC RATING
147th/ 347
METRIC RANK
50.2%
2 OR MORE VEHICLES IN HOUSEHOLD
0.0/ 100
METRIC RATING
301st/ 347
METRIC RANK
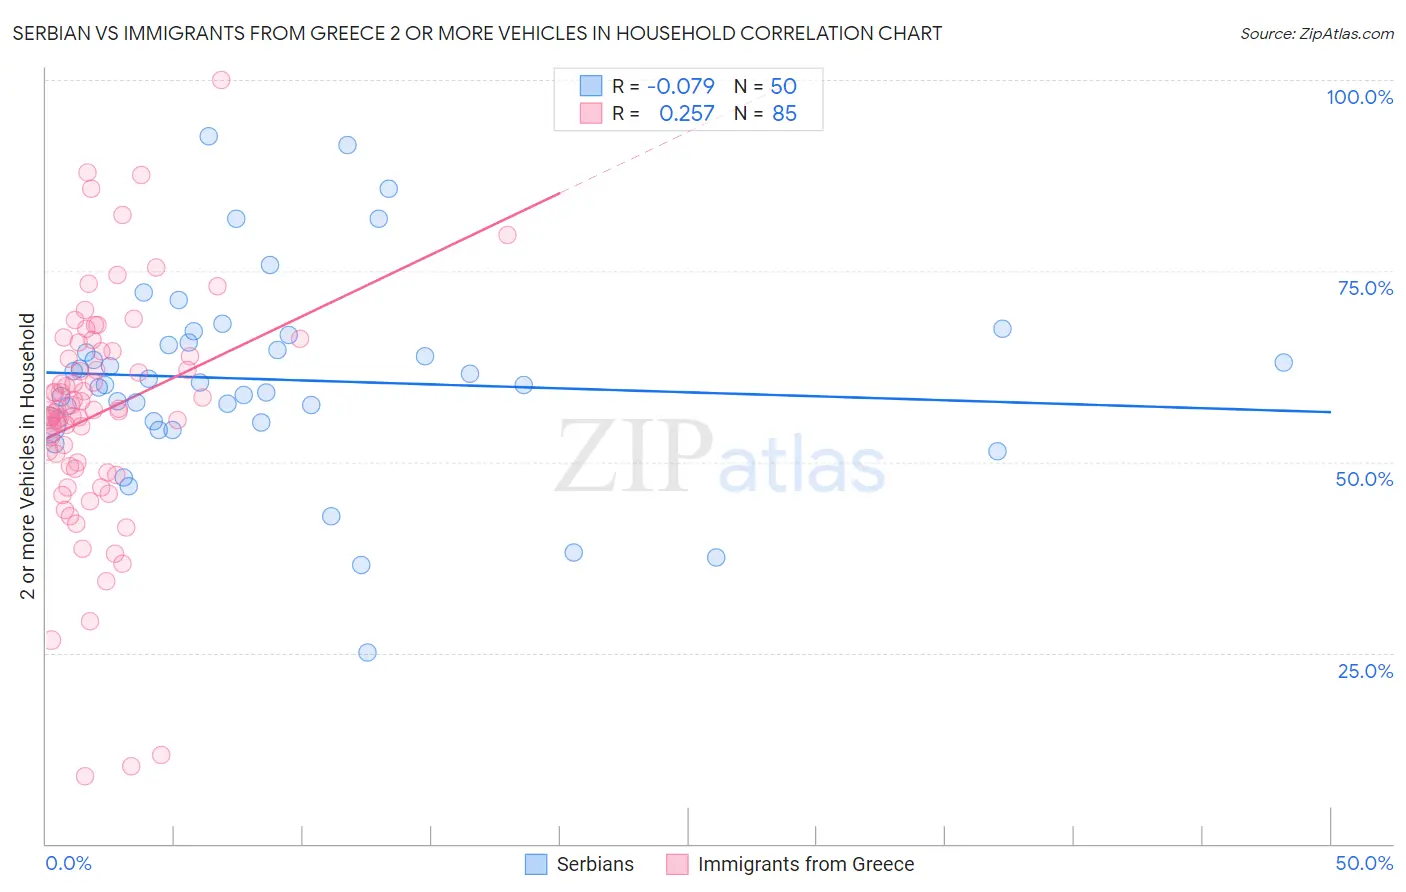
Serbian vs Immigrants from Greece 2 or more Vehicles in Household Correlation Chart
The statistical analysis conducted on geographies consisting of 267,548,486 people shows a slight negative correlation between the proportion of Serbians and percentage of households with 2 or more vehicles available in the United States with a correlation coefficient (R) of -0.079 and weighted average of 56.1%. Similarly, the statistical analysis conducted on geographies consisting of 216,819,966 people shows a weak positive correlation between the proportion of Immigrants from Greece and percentage of households with 2 or more vehicles available in the United States with a correlation coefficient (R) of 0.257 and weighted average of 50.2%, a difference of 11.8%.
2 or more Vehicles in Household Correlation Summary
| Measurement | Serbian | Immigrants from Greece |
| Minimum | 25.0% | 8.9% |
| Maximum | 92.6% | 100.0% |
| Range | 67.6% | 91.1% |
| Mean | 60.8% | 56.4% |
| Median | 60.2% | 56.7% |
| Interquartile 25% (IQ1) | 55.2% | 49.3% |
| Interquartile 75% (IQ3) | 65.6% | 64.5% |
| Interquartile Range (IQR) | 10.4% | 15.2% |
| Standard Deviation (Sample) | 12.9% | 15.5% |
| Standard Deviation (Population) | 12.8% | 15.4% |
Similar Demographics by 2 or more Vehicles in Household
Demographics Similar to Serbians by 2 or more Vehicles in Household
In terms of 2 or more vehicles in household, the demographic groups most similar to Serbians are Immigrants from Moldova (56.1%, a difference of 0.0%), Chilean (56.1%, a difference of 0.010%), Venezuelan (56.1%, a difference of 0.020%), Nicaraguan (56.1%, a difference of 0.030%), and Syrian (56.2%, a difference of 0.060%).
| Demographics | Rating | Rank | 2 or more Vehicles in Household |
| Latvians | 83.6 /100 | #140 | Excellent 56.2% |
| Immigrants | Cambodia | 83.6 /100 | #141 | Excellent 56.2% |
| South Africans | 83.1 /100 | #142 | Excellent 56.2% |
| Seminole | 81.7 /100 | #143 | Excellent 56.2% |
| Immigrants | Syria | 81.4 /100 | #144 | Excellent 56.2% |
| Syrians | 81.2 /100 | #145 | Excellent 56.2% |
| Venezuelans | 80.7 /100 | #146 | Excellent 56.1% |
| Serbians | 80.3 /100 | #147 | Excellent 56.1% |
| Immigrants | Moldova | 80.2 /100 | #148 | Excellent 56.1% |
| Chileans | 80.2 /100 | #149 | Excellent 56.1% |
| Nicaraguans | 79.9 /100 | #150 | Good 56.1% |
| Immigrants | Northern Europe | 78.7 /100 | #151 | Good 56.1% |
| Immigrants | Pakistan | 78.1 /100 | #152 | Good 56.1% |
| Lumbee | 71.9 /100 | #153 | Good 55.9% |
| Ukrainians | 70.8 /100 | #154 | Good 55.8% |
Demographics Similar to Immigrants from Greece by 2 or more Vehicles in Household
In terms of 2 or more vehicles in household, the demographic groups most similar to Immigrants from Greece are Immigrants from South America (50.2%, a difference of 0.060%), Immigrants from Russia (50.3%, a difference of 0.18%), Immigrants from Morocco (50.3%, a difference of 0.22%), Paraguayan (50.3%, a difference of 0.25%), and Immigrants from Spain (50.4%, a difference of 0.38%).
| Demographics | Rating | Rank | 2 or more Vehicles in Household |
| Bermudans | 0.0 /100 | #294 | Tragic 50.6% |
| Cypriots | 0.0 /100 | #295 | Tragic 50.6% |
| Immigrants | Somalia | 0.0 /100 | #296 | Tragic 50.5% |
| Immigrants | Spain | 0.0 /100 | #297 | Tragic 50.4% |
| Paraguayans | 0.0 /100 | #298 | Tragic 50.3% |
| Immigrants | Morocco | 0.0 /100 | #299 | Tragic 50.3% |
| Immigrants | Russia | 0.0 /100 | #300 | Tragic 50.3% |
| Immigrants | Greece | 0.0 /100 | #301 | Tragic 50.2% |
| Immigrants | South America | 0.0 /100 | #302 | Tragic 50.2% |
| Tohono O'odham | 0.0 /100 | #303 | Tragic 50.0% |
| Immigrants | Belize | 0.0 /100 | #304 | Tragic 49.9% |
| Immigrants | Western Africa | 0.0 /100 | #305 | Tragic 49.4% |
| Immigrants | Israel | 0.0 /100 | #306 | Tragic 49.2% |
| Hopi | 0.0 /100 | #307 | Tragic 49.0% |
| Albanians | 0.0 /100 | #308 | Tragic 49.0% |