Immigrants from Albania vs Immigrants from Greece 2 or more Vehicles in Household
COMPARE
Immigrants from Albania
Immigrants from Greece
2 or more Vehicles in Household
2 or more Vehicles in Household Comparison
Immigrants from Albania
Immigrants from Greece
46.0%
2 OR MORE VEHICLES IN HOUSEHOLD
0.0/ 100
METRIC RATING
318th/ 347
METRIC RANK
50.2%
2 OR MORE VEHICLES IN HOUSEHOLD
0.0/ 100
METRIC RATING
301st/ 347
METRIC RANK
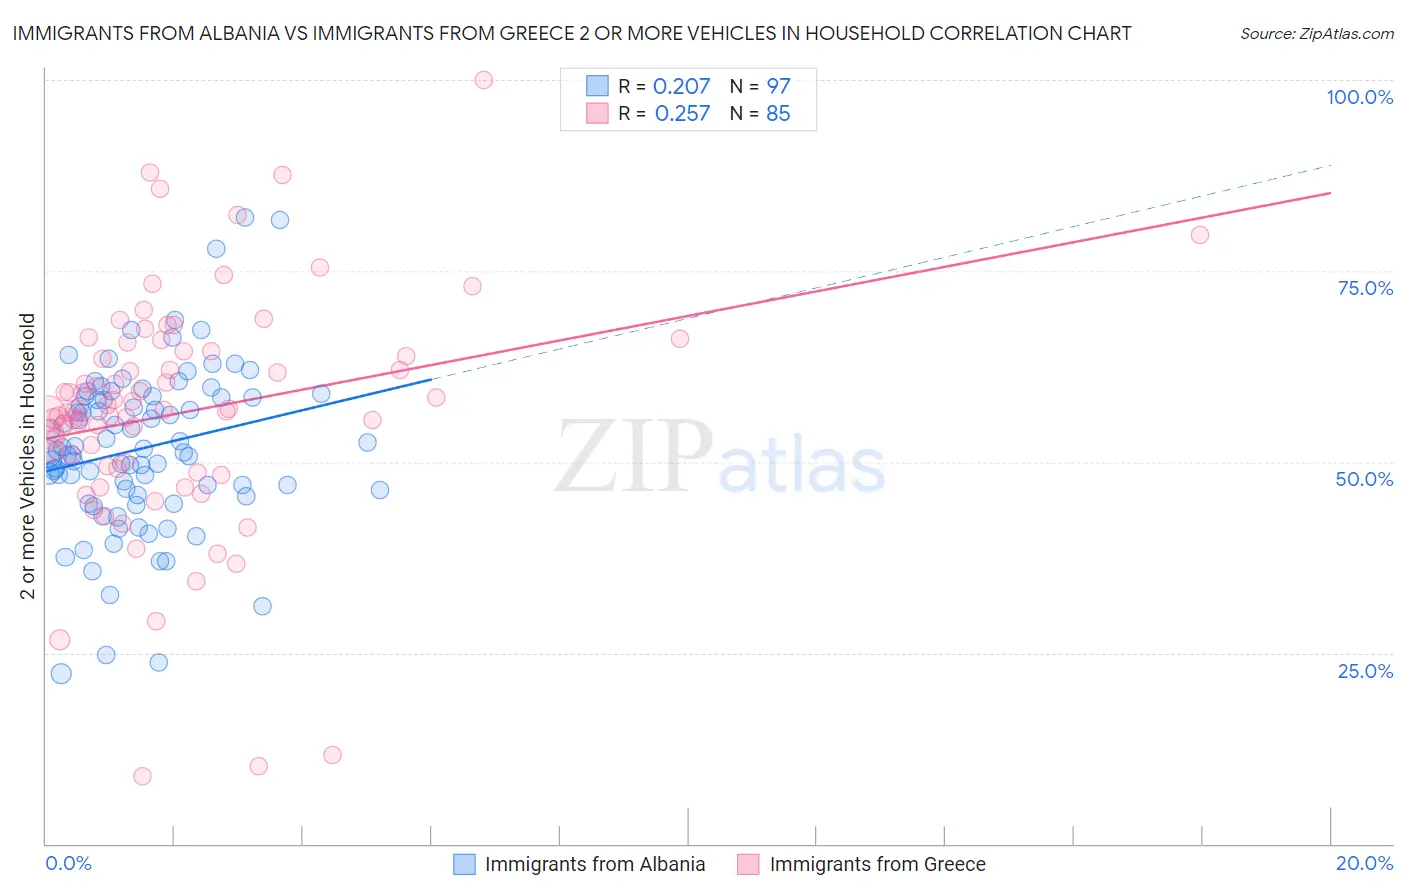
Immigrants from Albania vs Immigrants from Greece 2 or more Vehicles in Household Correlation Chart
The statistical analysis conducted on geographies consisting of 119,187,610 people shows a weak positive correlation between the proportion of Immigrants from Albania and percentage of households with 2 or more vehicles available in the United States with a correlation coefficient (R) of 0.207 and weighted average of 46.0%. Similarly, the statistical analysis conducted on geographies consisting of 216,819,966 people shows a weak positive correlation between the proportion of Immigrants from Greece and percentage of households with 2 or more vehicles available in the United States with a correlation coefficient (R) of 0.257 and weighted average of 50.2%, a difference of 9.1%.
2 or more Vehicles in Household Correlation Summary
| Measurement | Immigrants from Albania | Immigrants from Greece |
| Minimum | 22.2% | 8.9% |
| Maximum | 82.0% | 100.0% |
| Range | 59.8% | 91.1% |
| Mean | 51.7% | 56.4% |
| Median | 51.5% | 56.7% |
| Interquartile 25% (IQ1) | 46.0% | 49.3% |
| Interquartile 75% (IQ3) | 58.5% | 64.5% |
| Interquartile Range (IQR) | 12.5% | 15.2% |
| Standard Deviation (Sample) | 10.7% | 15.5% |
| Standard Deviation (Population) | 10.7% | 15.4% |
Demographics Similar to Immigrants from Albania and Immigrants from Greece by 2 or more Vehicles in Household
In terms of 2 or more vehicles in household, the demographic groups most similar to Immigrants from Albania are Jamaican (45.8%, a difference of 0.52%), Immigrants from Haiti (46.5%, a difference of 1.1%), Cape Verdean (46.8%, a difference of 1.7%), Puerto Rican (47.1%, a difference of 2.4%), and Immigrants from Ghana (47.4%, a difference of 3.0%). Similarly, the demographic groups most similar to Immigrants from Greece are Immigrants from South America (50.2%, a difference of 0.060%), Immigrants from Russia (50.3%, a difference of 0.18%), Immigrants from Morocco (50.3%, a difference of 0.22%), Tohono O'odham (50.0%, a difference of 0.43%), and Immigrants from Belize (49.9%, a difference of 0.63%).
| Demographics | Rating | Rank | 2 or more Vehicles in Household |
| Immigrants | Morocco | 0.0 /100 | #299 | Tragic 50.3% |
| Immigrants | Russia | 0.0 /100 | #300 | Tragic 50.3% |
| Immigrants | Greece | 0.0 /100 | #301 | Tragic 50.2% |
| Immigrants | South America | 0.0 /100 | #302 | Tragic 50.2% |
| Tohono O'odham | 0.0 /100 | #303 | Tragic 50.0% |
| Immigrants | Belize | 0.0 /100 | #304 | Tragic 49.9% |
| Immigrants | Western Africa | 0.0 /100 | #305 | Tragic 49.4% |
| Immigrants | Israel | 0.0 /100 | #306 | Tragic 49.2% |
| Hopi | 0.0 /100 | #307 | Tragic 49.0% |
| Albanians | 0.0 /100 | #308 | Tragic 49.0% |
| Moroccans | 0.0 /100 | #309 | Tragic 48.8% |
| Ghanaians | 0.0 /100 | #310 | Tragic 48.0% |
| Immigrants | Belarus | 0.0 /100 | #311 | Tragic 47.9% |
| Haitians | 0.0 /100 | #312 | Tragic 47.6% |
| U.S. Virgin Islanders | 0.0 /100 | #313 | Tragic 47.5% |
| Immigrants | Ghana | 0.0 /100 | #314 | Tragic 47.4% |
| Puerto Ricans | 0.0 /100 | #315 | Tragic 47.1% |
| Cape Verdeans | 0.0 /100 | #316 | Tragic 46.8% |
| Immigrants | Haiti | 0.0 /100 | #317 | Tragic 46.5% |
| Immigrants | Albania | 0.0 /100 | #318 | Tragic 46.0% |
| Jamaicans | 0.0 /100 | #319 | Tragic 45.8% |