Lebanese vs Immigrants from Greece 2 or more Vehicles in Household
COMPARE
Lebanese
Immigrants from Greece
2 or more Vehicles in Household
2 or more Vehicles in Household Comparison
Lebanese
Immigrants from Greece
57.6%
2 OR MORE VEHICLES IN HOUSEHOLD
98.3/ 100
METRIC RATING
101st/ 347
METRIC RANK
50.2%
2 OR MORE VEHICLES IN HOUSEHOLD
0.0/ 100
METRIC RATING
301st/ 347
METRIC RANK
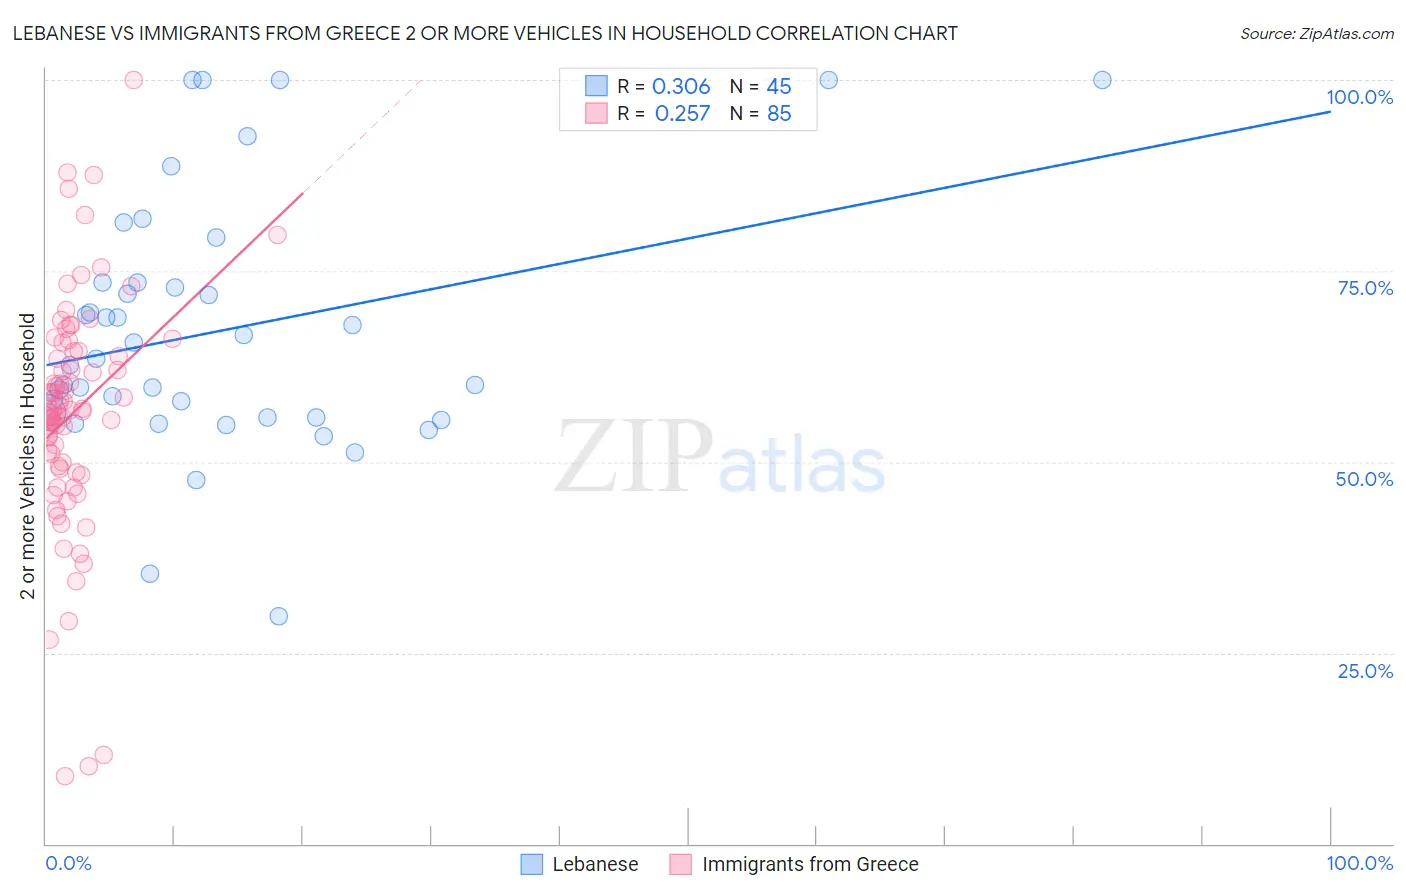
Lebanese vs Immigrants from Greece 2 or more Vehicles in Household Correlation Chart
The statistical analysis conducted on geographies consisting of 401,369,606 people shows a mild positive correlation between the proportion of Lebanese and percentage of households with 2 or more vehicles available in the United States with a correlation coefficient (R) of 0.306 and weighted average of 57.6%. Similarly, the statistical analysis conducted on geographies consisting of 216,819,966 people shows a weak positive correlation between the proportion of Immigrants from Greece and percentage of households with 2 or more vehicles available in the United States with a correlation coefficient (R) of 0.257 and weighted average of 50.2%, a difference of 14.7%.
2 or more Vehicles in Household Correlation Summary
| Measurement | Lebanese | Immigrants from Greece |
| Minimum | 29.8% | 8.9% |
| Maximum | 100.0% | 100.0% |
| Range | 70.2% | 91.1% |
| Mean | 67.2% | 56.4% |
| Median | 63.5% | 56.7% |
| Interquartile 25% (IQ1) | 55.8% | 49.3% |
| Interquartile 75% (IQ3) | 73.5% | 64.5% |
| Interquartile Range (IQR) | 17.8% | 15.2% |
| Standard Deviation (Sample) | 16.6% | 15.5% |
| Standard Deviation (Population) | 16.4% | 15.4% |
Similar Demographics by 2 or more Vehicles in Household
Demographics Similar to Lebanese by 2 or more Vehicles in Household
In terms of 2 or more vehicles in household, the demographic groups most similar to Lebanese are Fijian (57.6%, a difference of 0.050%), Immigrants from Bolivia (57.6%, a difference of 0.050%), Jordanian (57.6%, a difference of 0.050%), Immigrants from Indonesia (57.6%, a difference of 0.050%), and Immigrants from Korea (57.6%, a difference of 0.050%).
| Demographics | Rating | Rank | 2 or more Vehicles in Household |
| Filipinos | 98.9 /100 | #94 | Exceptional 57.8% |
| Hmong | 98.9 /100 | #95 | Exceptional 57.8% |
| Burmese | 98.8 /100 | #96 | Exceptional 57.8% |
| Slavs | 98.8 /100 | #97 | Exceptional 57.8% |
| Palestinians | 98.6 /100 | #98 | Exceptional 57.7% |
| Cajuns | 98.5 /100 | #99 | Exceptional 57.7% |
| Fijians | 98.4 /100 | #100 | Exceptional 57.6% |
| Lebanese | 98.3 /100 | #101 | Exceptional 57.6% |
| Immigrants | Bolivia | 98.2 /100 | #102 | Exceptional 57.6% |
| Jordanians | 98.2 /100 | #103 | Exceptional 57.6% |
| Immigrants | Indonesia | 98.2 /100 | #104 | Exceptional 57.6% |
| Immigrants | Korea | 98.2 /100 | #105 | Exceptional 57.6% |
| Immigrants | Oceania | 98.2 /100 | #106 | Exceptional 57.5% |
| Immigrants | Netherlands | 98.2 /100 | #107 | Exceptional 57.5% |
| Immigrants | Canada | 98.1 /100 | #108 | Exceptional 57.5% |
Demographics Similar to Immigrants from Greece by 2 or more Vehicles in Household
In terms of 2 or more vehicles in household, the demographic groups most similar to Immigrants from Greece are Immigrants from South America (50.2%, a difference of 0.060%), Immigrants from Russia (50.3%, a difference of 0.18%), Immigrants from Morocco (50.3%, a difference of 0.22%), Paraguayan (50.3%, a difference of 0.25%), and Immigrants from Spain (50.4%, a difference of 0.38%).
| Demographics | Rating | Rank | 2 or more Vehicles in Household |
| Bermudans | 0.0 /100 | #294 | Tragic 50.6% |
| Cypriots | 0.0 /100 | #295 | Tragic 50.6% |
| Immigrants | Somalia | 0.0 /100 | #296 | Tragic 50.5% |
| Immigrants | Spain | 0.0 /100 | #297 | Tragic 50.4% |
| Paraguayans | 0.0 /100 | #298 | Tragic 50.3% |
| Immigrants | Morocco | 0.0 /100 | #299 | Tragic 50.3% |
| Immigrants | Russia | 0.0 /100 | #300 | Tragic 50.3% |
| Immigrants | Greece | 0.0 /100 | #301 | Tragic 50.2% |
| Immigrants | South America | 0.0 /100 | #302 | Tragic 50.2% |
| Tohono O'odham | 0.0 /100 | #303 | Tragic 50.0% |
| Immigrants | Belize | 0.0 /100 | #304 | Tragic 49.9% |
| Immigrants | Western Africa | 0.0 /100 | #305 | Tragic 49.4% |
| Immigrants | Israel | 0.0 /100 | #306 | Tragic 49.2% |
| Hopi | 0.0 /100 | #307 | Tragic 49.0% |
| Albanians | 0.0 /100 | #308 | Tragic 49.0% |