Serbian vs Immigrants from Panama 2 or more Vehicles in Household
COMPARE
Serbian
Immigrants from Panama
2 or more Vehicles in Household
2 or more Vehicles in Household Comparison
Serbians
Immigrants from Panama
56.1%
2 OR MORE VEHICLES IN HOUSEHOLD
80.3/ 100
METRIC RATING
147th/ 347
METRIC RANK
51.1%
2 OR MORE VEHICLES IN HOUSEHOLD
0.0/ 100
METRIC RATING
290th/ 347
METRIC RANK
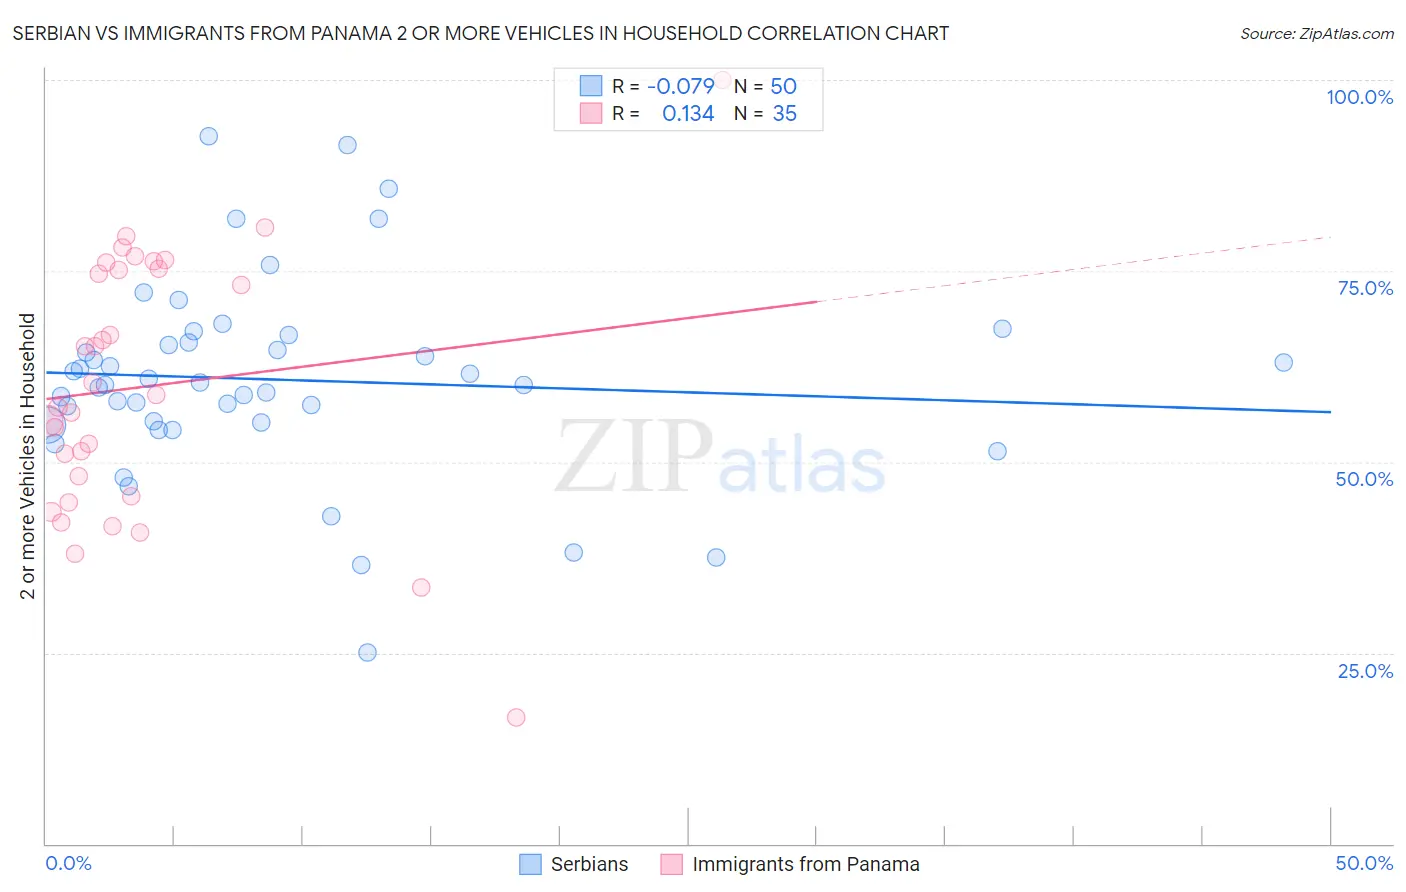
Serbian vs Immigrants from Panama 2 or more Vehicles in Household Correlation Chart
The statistical analysis conducted on geographies consisting of 267,548,486 people shows a slight negative correlation between the proportion of Serbians and percentage of households with 2 or more vehicles available in the United States with a correlation coefficient (R) of -0.079 and weighted average of 56.1%. Similarly, the statistical analysis conducted on geographies consisting of 221,156,465 people shows a poor positive correlation between the proportion of Immigrants from Panama and percentage of households with 2 or more vehicles available in the United States with a correlation coefficient (R) of 0.134 and weighted average of 51.1%, a difference of 9.9%.
2 or more Vehicles in Household Correlation Summary
| Measurement | Serbian | Immigrants from Panama |
| Minimum | 25.0% | 16.5% |
| Maximum | 92.6% | 100.0% |
| Range | 67.6% | 83.5% |
| Mean | 60.8% | 59.9% |
| Median | 60.2% | 58.8% |
| Interquartile 25% (IQ1) | 55.2% | 45.5% |
| Interquartile 75% (IQ3) | 65.6% | 75.3% |
| Interquartile Range (IQR) | 10.4% | 29.8% |
| Standard Deviation (Sample) | 12.9% | 17.2% |
| Standard Deviation (Population) | 12.8% | 16.9% |
Similar Demographics by 2 or more Vehicles in Household
Demographics Similar to Serbians by 2 or more Vehicles in Household
In terms of 2 or more vehicles in household, the demographic groups most similar to Serbians are Immigrants from Moldova (56.1%, a difference of 0.0%), Chilean (56.1%, a difference of 0.010%), Venezuelan (56.1%, a difference of 0.020%), Nicaraguan (56.1%, a difference of 0.030%), and Syrian (56.2%, a difference of 0.060%).
| Demographics | Rating | Rank | 2 or more Vehicles in Household |
| Latvians | 83.6 /100 | #140 | Excellent 56.2% |
| Immigrants | Cambodia | 83.6 /100 | #141 | Excellent 56.2% |
| South Africans | 83.1 /100 | #142 | Excellent 56.2% |
| Seminole | 81.7 /100 | #143 | Excellent 56.2% |
| Immigrants | Syria | 81.4 /100 | #144 | Excellent 56.2% |
| Syrians | 81.2 /100 | #145 | Excellent 56.2% |
| Venezuelans | 80.7 /100 | #146 | Excellent 56.1% |
| Serbians | 80.3 /100 | #147 | Excellent 56.1% |
| Immigrants | Moldova | 80.2 /100 | #148 | Excellent 56.1% |
| Chileans | 80.2 /100 | #149 | Excellent 56.1% |
| Nicaraguans | 79.9 /100 | #150 | Good 56.1% |
| Immigrants | Northern Europe | 78.7 /100 | #151 | Good 56.1% |
| Immigrants | Pakistan | 78.1 /100 | #152 | Good 56.1% |
| Lumbee | 71.9 /100 | #153 | Good 55.9% |
| Ukrainians | 70.8 /100 | #154 | Good 55.8% |
Demographics Similar to Immigrants from Panama by 2 or more Vehicles in Household
In terms of 2 or more vehicles in household, the demographic groups most similar to Immigrants from Panama are Belizean (51.0%, a difference of 0.030%), Somali (51.1%, a difference of 0.060%), Okinawan (51.2%, a difference of 0.35%), Immigrants from Ukraine (50.9%, a difference of 0.36%), and Black/African American (50.9%, a difference of 0.37%).
| Demographics | Rating | Rank | 2 or more Vehicles in Household |
| Immigrants | China | 0.1 /100 | #283 | Tragic 51.5% |
| Immigrants | Zaire | 0.1 /100 | #284 | Tragic 51.5% |
| Immigrants | Uruguay | 0.1 /100 | #285 | Tragic 51.4% |
| Immigrants | Liberia | 0.1 /100 | #286 | Tragic 51.3% |
| Immigrants | Serbia | 0.1 /100 | #287 | Tragic 51.3% |
| Okinawans | 0.1 /100 | #288 | Tragic 51.2% |
| Somalis | 0.0 /100 | #289 | Tragic 51.1% |
| Immigrants | Panama | 0.0 /100 | #290 | Tragic 51.1% |
| Belizeans | 0.0 /100 | #291 | Tragic 51.0% |
| Immigrants | Ukraine | 0.0 /100 | #292 | Tragic 50.9% |
| Blacks/African Americans | 0.0 /100 | #293 | Tragic 50.9% |
| Bermudans | 0.0 /100 | #294 | Tragic 50.6% |
| Cypriots | 0.0 /100 | #295 | Tragic 50.6% |
| Immigrants | Somalia | 0.0 /100 | #296 | Tragic 50.5% |
| Immigrants | Spain | 0.0 /100 | #297 | Tragic 50.4% |