Mexican vs Immigrants from Greece 2 or more Vehicles in Household
COMPARE
Mexican
Immigrants from Greece
2 or more Vehicles in Household
2 or more Vehicles in Household Comparison
Mexicans
Immigrants from Greece
61.7%
2 OR MORE VEHICLES IN HOUSEHOLD
100.0/ 100
METRIC RATING
10th/ 347
METRIC RANK
50.2%
2 OR MORE VEHICLES IN HOUSEHOLD
0.0/ 100
METRIC RATING
301st/ 347
METRIC RANK
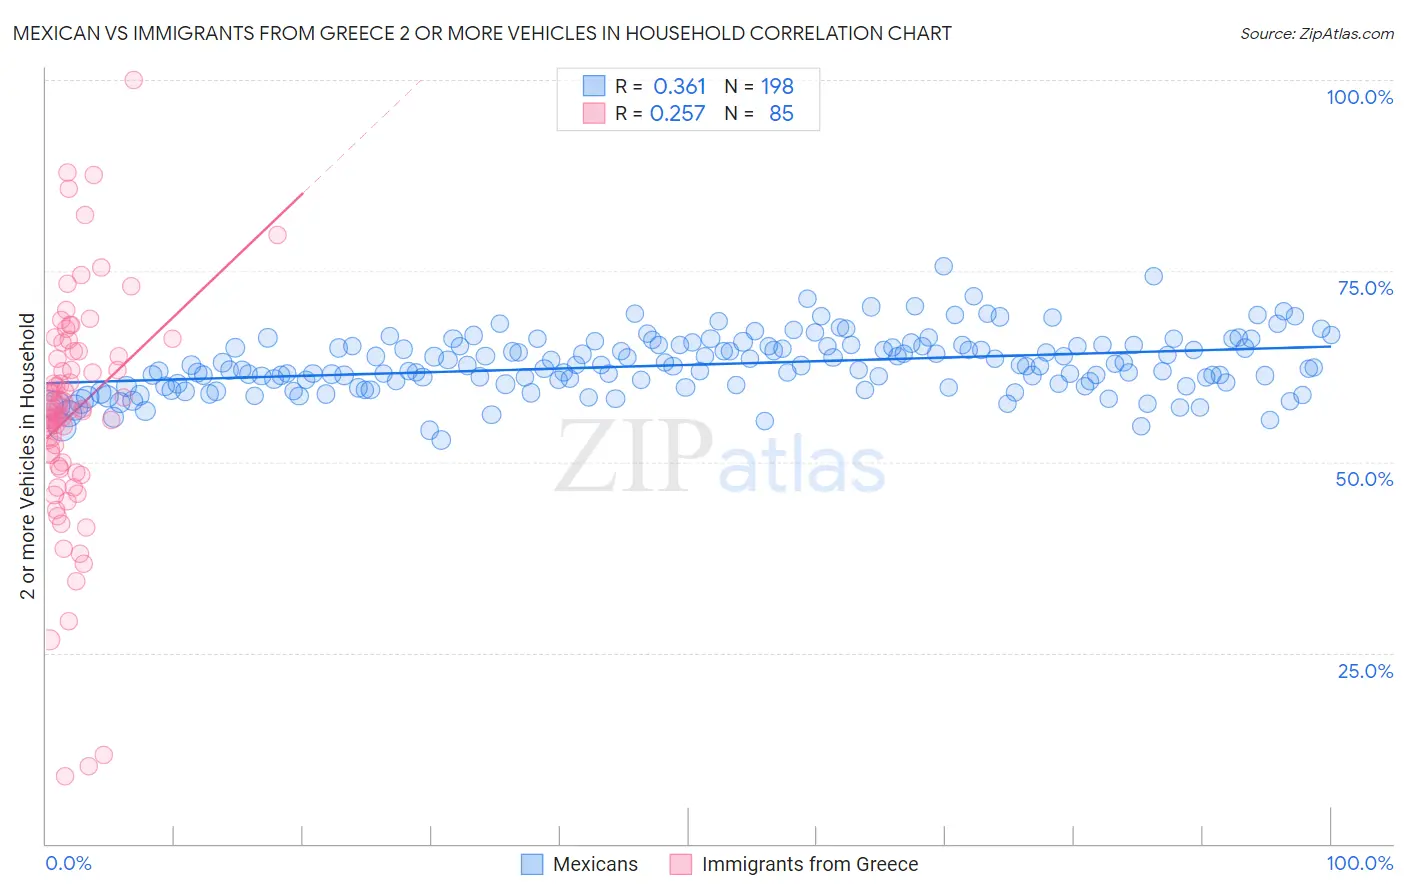
Mexican vs Immigrants from Greece 2 or more Vehicles in Household Correlation Chart
The statistical analysis conducted on geographies consisting of 536,751,978 people shows a mild positive correlation between the proportion of Mexicans and percentage of households with 2 or more vehicles available in the United States with a correlation coefficient (R) of 0.361 and weighted average of 61.7%. Similarly, the statistical analysis conducted on geographies consisting of 216,819,966 people shows a weak positive correlation between the proportion of Immigrants from Greece and percentage of households with 2 or more vehicles available in the United States with a correlation coefficient (R) of 0.257 and weighted average of 50.2%, a difference of 22.8%.
2 or more Vehicles in Household Correlation Summary
| Measurement | Mexican | Immigrants from Greece |
| Minimum | 52.9% | 8.9% |
| Maximum | 75.7% | 100.0% |
| Range | 22.7% | 91.1% |
| Mean | 62.7% | 56.4% |
| Median | 62.5% | 56.7% |
| Interquartile 25% (IQ1) | 60.0% | 49.3% |
| Interquartile 75% (IQ3) | 65.2% | 64.5% |
| Interquartile Range (IQR) | 5.2% | 15.2% |
| Standard Deviation (Sample) | 3.8% | 15.5% |
| Standard Deviation (Population) | 3.8% | 15.4% |
Similar Demographics by 2 or more Vehicles in Household
Demographics Similar to Mexicans by 2 or more Vehicles in Household
In terms of 2 or more vehicles in household, the demographic groups most similar to Mexicans are Dutch (61.6%, a difference of 0.050%), German (61.6%, a difference of 0.17%), Swedish (61.8%, a difference of 0.28%), Samoan (61.5%, a difference of 0.28%), and Czech (61.5%, a difference of 0.33%).
| Demographics | Rating | Rank | 2 or more Vehicles in Household |
| Danes | 100.0 /100 | #3 | Exceptional 63.3% |
| Norwegians | 100.0 /100 | #4 | Exceptional 62.8% |
| Immigrants | Fiji | 100.0 /100 | #5 | Exceptional 62.3% |
| Scandinavians | 100.0 /100 | #6 | Exceptional 62.1% |
| Puget Sound Salish | 100.0 /100 | #7 | Exceptional 62.1% |
| English | 100.0 /100 | #8 | Exceptional 61.9% |
| Swedes | 100.0 /100 | #9 | Exceptional 61.8% |
| Mexicans | 100.0 /100 | #10 | Exceptional 61.7% |
| Dutch | 100.0 /100 | #11 | Exceptional 61.6% |
| Germans | 100.0 /100 | #12 | Exceptional 61.6% |
| Samoans | 100.0 /100 | #13 | Exceptional 61.5% |
| Czechs | 100.0 /100 | #14 | Exceptional 61.5% |
| Nepalese | 100.0 /100 | #15 | Exceptional 61.4% |
| Native Hawaiians | 100.0 /100 | #16 | Exceptional 61.4% |
| Basques | 100.0 /100 | #17 | Exceptional 61.4% |
Demographics Similar to Immigrants from Greece by 2 or more Vehicles in Household
In terms of 2 or more vehicles in household, the demographic groups most similar to Immigrants from Greece are Immigrants from South America (50.2%, a difference of 0.060%), Immigrants from Russia (50.3%, a difference of 0.18%), Immigrants from Morocco (50.3%, a difference of 0.22%), Paraguayan (50.3%, a difference of 0.25%), and Immigrants from Spain (50.4%, a difference of 0.38%).
| Demographics | Rating | Rank | 2 or more Vehicles in Household |
| Bermudans | 0.0 /100 | #294 | Tragic 50.6% |
| Cypriots | 0.0 /100 | #295 | Tragic 50.6% |
| Immigrants | Somalia | 0.0 /100 | #296 | Tragic 50.5% |
| Immigrants | Spain | 0.0 /100 | #297 | Tragic 50.4% |
| Paraguayans | 0.0 /100 | #298 | Tragic 50.3% |
| Immigrants | Morocco | 0.0 /100 | #299 | Tragic 50.3% |
| Immigrants | Russia | 0.0 /100 | #300 | Tragic 50.3% |
| Immigrants | Greece | 0.0 /100 | #301 | Tragic 50.2% |
| Immigrants | South America | 0.0 /100 | #302 | Tragic 50.2% |
| Tohono O'odham | 0.0 /100 | #303 | Tragic 50.0% |
| Immigrants | Belize | 0.0 /100 | #304 | Tragic 49.9% |
| Immigrants | Western Africa | 0.0 /100 | #305 | Tragic 49.4% |
| Immigrants | Israel | 0.0 /100 | #306 | Tragic 49.2% |
| Hopi | 0.0 /100 | #307 | Tragic 49.0% |
| Albanians | 0.0 /100 | #308 | Tragic 49.0% |