Serbian vs Nonimmigrants 2 or more Vehicles in Household
COMPARE
Serbian
Nonimmigrants
2 or more Vehicles in Household
2 or more Vehicles in Household Comparison
Serbians
Nonimmigrants
56.1%
2 OR MORE VEHICLES IN HOUSEHOLD
80.3/ 100
METRIC RATING
147th/ 347
METRIC RANK
58.8%
2 OR MORE VEHICLES IN HOUSEHOLD
99.8/ 100
METRIC RATING
62nd/ 347
METRIC RANK
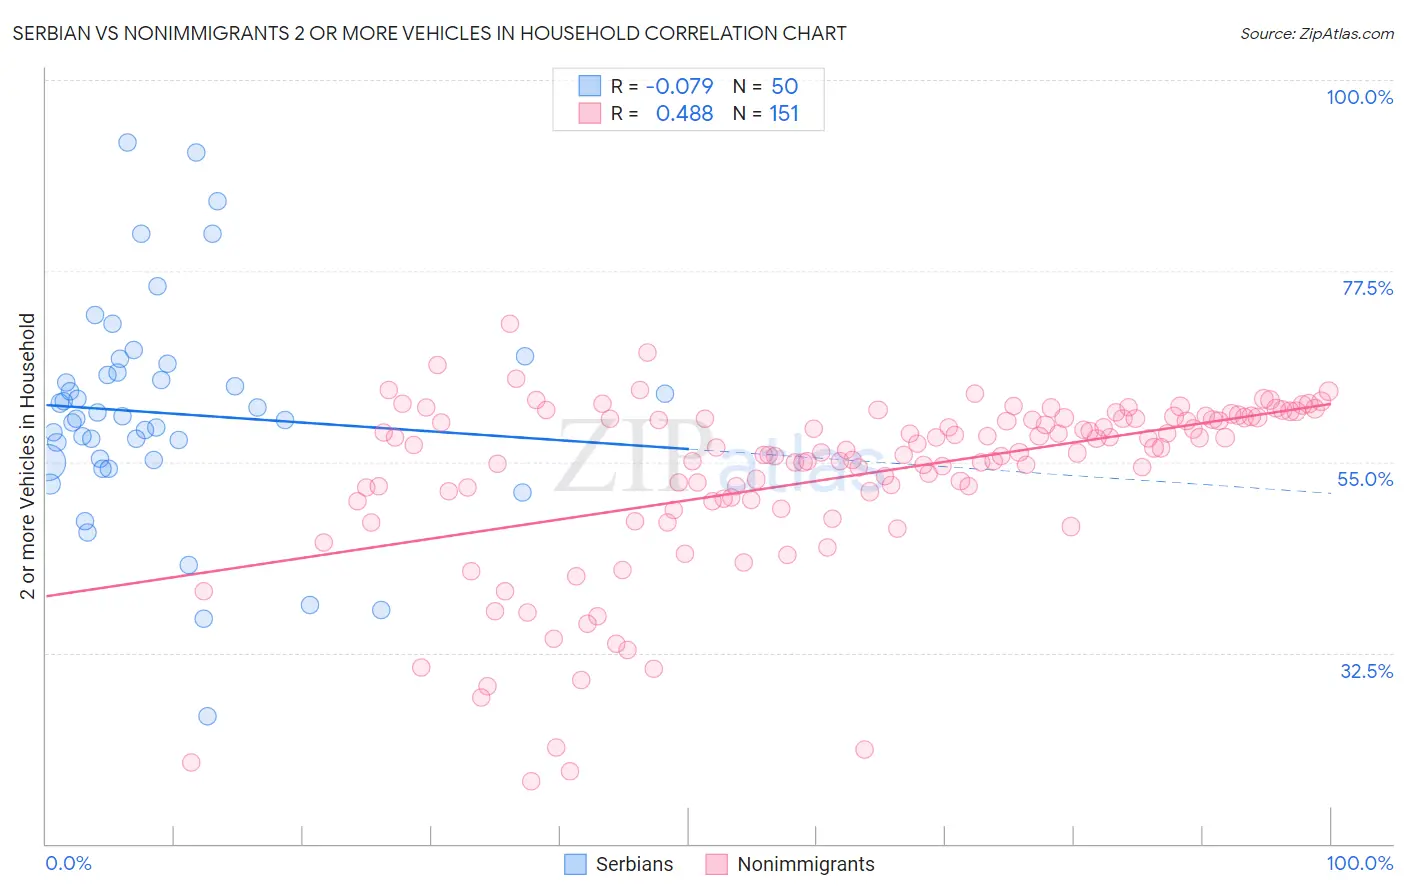
Serbian vs Nonimmigrants 2 or more Vehicles in Household Correlation Chart
The statistical analysis conducted on geographies consisting of 267,548,486 people shows a slight negative correlation between the proportion of Serbians and percentage of households with 2 or more vehicles available in the United States with a correlation coefficient (R) of -0.079 and weighted average of 56.1%. Similarly, the statistical analysis conducted on geographies consisting of 584,662,841 people shows a moderate positive correlation between the proportion of Nonimmigrants and percentage of households with 2 or more vehicles available in the United States with a correlation coefficient (R) of 0.488 and weighted average of 58.8%, a difference of 4.7%.
2 or more Vehicles in Household Correlation Summary
| Measurement | Serbian | Nonimmigrants |
| Minimum | 25.0% | 17.3% |
| Maximum | 92.6% | 71.2% |
| Range | 67.6% | 53.9% |
| Mean | 60.8% | 53.2% |
| Median | 60.2% | 56.1% |
| Interquartile 25% (IQ1) | 55.2% | 50.6% |
| Interquartile 75% (IQ3) | 65.6% | 60.1% |
| Interquartile Range (IQR) | 10.4% | 9.6% |
| Standard Deviation (Sample) | 12.9% | 10.5% |
| Standard Deviation (Population) | 12.8% | 10.5% |
Similar Demographics by 2 or more Vehicles in Household
Demographics Similar to Serbians by 2 or more Vehicles in Household
In terms of 2 or more vehicles in household, the demographic groups most similar to Serbians are Immigrants from Moldova (56.1%, a difference of 0.0%), Chilean (56.1%, a difference of 0.010%), Venezuelan (56.1%, a difference of 0.020%), Nicaraguan (56.1%, a difference of 0.030%), and Syrian (56.2%, a difference of 0.060%).
| Demographics | Rating | Rank | 2 or more Vehicles in Household |
| Latvians | 83.6 /100 | #140 | Excellent 56.2% |
| Immigrants | Cambodia | 83.6 /100 | #141 | Excellent 56.2% |
| South Africans | 83.1 /100 | #142 | Excellent 56.2% |
| Seminole | 81.7 /100 | #143 | Excellent 56.2% |
| Immigrants | Syria | 81.4 /100 | #144 | Excellent 56.2% |
| Syrians | 81.2 /100 | #145 | Excellent 56.2% |
| Venezuelans | 80.7 /100 | #146 | Excellent 56.1% |
| Serbians | 80.3 /100 | #147 | Excellent 56.1% |
| Immigrants | Moldova | 80.2 /100 | #148 | Excellent 56.1% |
| Chileans | 80.2 /100 | #149 | Excellent 56.1% |
| Nicaraguans | 79.9 /100 | #150 | Good 56.1% |
| Immigrants | Northern Europe | 78.7 /100 | #151 | Good 56.1% |
| Immigrants | Pakistan | 78.1 /100 | #152 | Good 56.1% |
| Lumbee | 71.9 /100 | #153 | Good 55.9% |
| Ukrainians | 70.8 /100 | #154 | Good 55.8% |
Demographics Similar to Nonimmigrants by 2 or more Vehicles in Household
In terms of 2 or more vehicles in household, the demographic groups most similar to Nonimmigrants are Osage (58.8%, a difference of 0.040%), Mexican American Indian (58.7%, a difference of 0.070%), French Canadian (58.9%, a difference of 0.17%), Spanish American (58.9%, a difference of 0.19%), and Immigrants from Scotland (58.9%, a difference of 0.22%).
| Demographics | Rating | Rank | 2 or more Vehicles in Household |
| Luxembourgers | 99.9 /100 | #55 | Exceptional 59.1% |
| Chickasaw | 99.9 /100 | #56 | Exceptional 59.0% |
| Afghans | 99.9 /100 | #57 | Exceptional 59.0% |
| Immigrants | Scotland | 99.8 /100 | #58 | Exceptional 58.9% |
| Spanish Americans | 99.8 /100 | #59 | Exceptional 58.9% |
| French Canadians | 99.8 /100 | #60 | Exceptional 58.9% |
| Osage | 99.8 /100 | #61 | Exceptional 58.8% |
| Immigrants | Nonimmigrants | 99.8 /100 | #62 | Exceptional 58.8% |
| Mexican American Indians | 99.8 /100 | #63 | Exceptional 58.7% |
| Portuguese | 99.7 /100 | #64 | Exceptional 58.6% |
| Immigrants | Central America | 99.7 /100 | #65 | Exceptional 58.6% |
| Croatians | 99.7 /100 | #66 | Exceptional 58.6% |
| Laotians | 99.7 /100 | #67 | Exceptional 58.6% |
| Canadians | 99.7 /100 | #68 | Exceptional 58.6% |
| Pennsylvania Germans | 99.7 /100 | #69 | Exceptional 58.5% |