Serbian vs Immigrants from Greece 2nd Grade
COMPARE
Serbian
Immigrants from Greece
2nd Grade
2nd Grade Comparison
Serbians
Immigrants from Greece
98.3%
2ND GRADE
99.6/ 100
METRIC RATING
70th/ 347
METRIC RANK
98.0%
2ND GRADE
76.8/ 100
METRIC RATING
147th/ 347
METRIC RANK
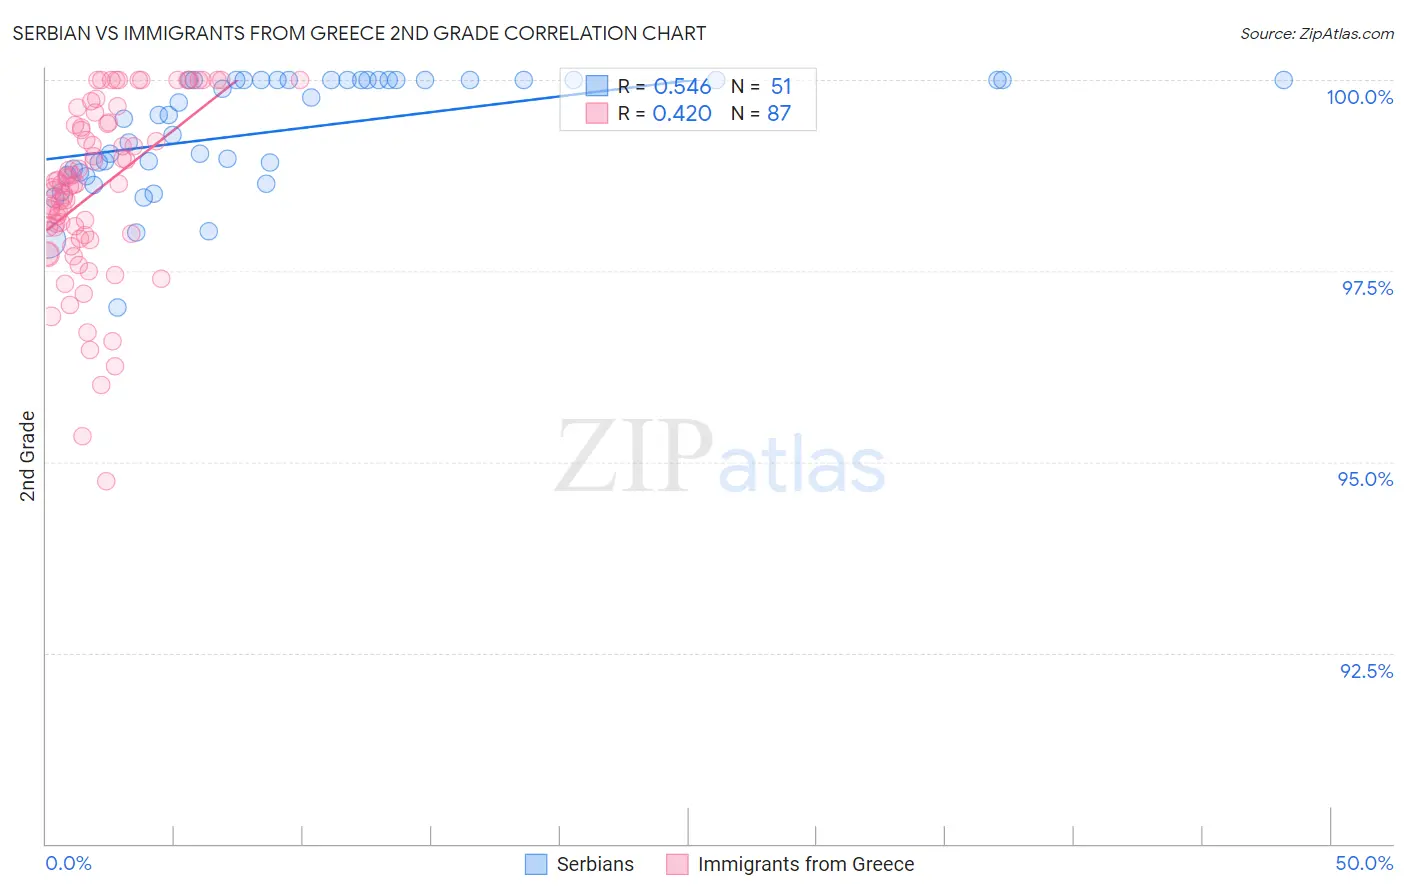
Serbian vs Immigrants from Greece 2nd Grade Correlation Chart
The statistical analysis conducted on geographies consisting of 267,642,942 people shows a substantial positive correlation between the proportion of Serbians and percentage of population with at least 2nd grade education in the United States with a correlation coefficient (R) of 0.546 and weighted average of 98.3%. Similarly, the statistical analysis conducted on geographies consisting of 216,879,847 people shows a moderate positive correlation between the proportion of Immigrants from Greece and percentage of population with at least 2nd grade education in the United States with a correlation coefficient (R) of 0.420 and weighted average of 98.0%, a difference of 0.35%.
2nd Grade Correlation Summary
| Measurement | Serbian | Immigrants from Greece |
| Minimum | 97.0% | 94.8% |
| Maximum | 100.0% | 100.0% |
| Range | 3.0% | 5.2% |
| Mean | 99.3% | 98.6% |
| Median | 99.5% | 98.6% |
| Interquartile 25% (IQ1) | 98.8% | 98.0% |
| Interquartile 75% (IQ3) | 100.0% | 99.4% |
| Interquartile Range (IQR) | 1.2% | 1.5% |
| Standard Deviation (Sample) | 0.74% | 1.1% |
| Standard Deviation (Population) | 0.73% | 1.1% |
Similar Demographics by 2nd Grade
Demographics Similar to Serbians by 2nd Grade
In terms of 2nd grade, the demographic groups most similar to Serbians are Immigrants from Northern Europe (98.3%, a difference of 0.0%), Russian (98.3%, a difference of 0.0%), Immigrants from Austria (98.3%, a difference of 0.0%), Chickasaw (98.3%, a difference of 0.0%), and Canadian (98.3%, a difference of 0.010%).
| Demographics | Rating | Rank | 2nd Grade |
| Maltese | 99.7 /100 | #63 | Exceptional 98.3% |
| Immigrants | North America | 99.7 /100 | #64 | Exceptional 98.3% |
| New Zealanders | 99.7 /100 | #65 | Exceptional 98.3% |
| Canadians | 99.7 /100 | #66 | Exceptional 98.3% |
| Immigrants | Northern Europe | 99.7 /100 | #67 | Exceptional 98.3% |
| Russians | 99.7 /100 | #68 | Exceptional 98.3% |
| Immigrants | Austria | 99.6 /100 | #69 | Exceptional 98.3% |
| Serbians | 99.6 /100 | #70 | Exceptional 98.3% |
| Chickasaw | 99.6 /100 | #71 | Exceptional 98.3% |
| Cheyenne | 99.6 /100 | #72 | Exceptional 98.3% |
| Cajuns | 99.5 /100 | #73 | Exceptional 98.3% |
| Immigrants | Netherlands | 99.4 /100 | #74 | Exceptional 98.3% |
| Shoshone | 99.4 /100 | #75 | Exceptional 98.3% |
| Cherokee | 99.4 /100 | #76 | Exceptional 98.3% |
| Immigrants | England | 99.4 /100 | #77 | Exceptional 98.3% |
Demographics Similar to Immigrants from Greece by 2nd Grade
In terms of 2nd grade, the demographic groups most similar to Immigrants from Greece are Hmong (98.0%, a difference of 0.010%), Filipino (98.0%, a difference of 0.010%), Immigrants from Israel (98.0%, a difference of 0.010%), Jordanian (98.0%, a difference of 0.010%), and Apache (97.9%, a difference of 0.010%).
| Demographics | Rating | Rank | 2nd Grade |
| Palestinians | 83.9 /100 | #140 | Excellent 98.0% |
| Immigrants | Turkey | 83.0 /100 | #141 | Excellent 98.0% |
| Burmese | 81.0 /100 | #142 | Excellent 98.0% |
| Alsatians | 80.5 /100 | #143 | Excellent 98.0% |
| Hmong | 80.0 /100 | #144 | Good 98.0% |
| Filipinos | 79.2 /100 | #145 | Good 98.0% |
| Immigrants | Israel | 78.0 /100 | #146 | Good 98.0% |
| Immigrants | Greece | 76.8 /100 | #147 | Good 98.0% |
| Jordanians | 74.5 /100 | #148 | Good 98.0% |
| Apache | 74.0 /100 | #149 | Good 97.9% |
| Immigrants | Moldova | 72.9 /100 | #150 | Good 97.9% |
| Soviet Union | 70.7 /100 | #151 | Good 97.9% |
| Immigrants | North Macedonia | 68.5 /100 | #152 | Good 97.9% |
| Immigrants | South Central Asia | 68.3 /100 | #153 | Good 97.9% |
| Marshallese | 67.7 /100 | #154 | Good 97.9% |