Salvadoran vs Immigrants from the Azores No Vehicles in Household
COMPARE
Salvadoran
Immigrants from the Azores
No Vehicles in Household
No Vehicles in Household Comparison
Salvadorans
Immigrants from the Azores
10.1%
NO VEHICLES IN HOUSEHOLD
72.4/ 100
METRIC RATING
155th/ 347
METRIC RANK
9.7%
NO VEHICLES IN HOUSEHOLD
88.2/ 100
METRIC RATING
131st/ 347
METRIC RANK
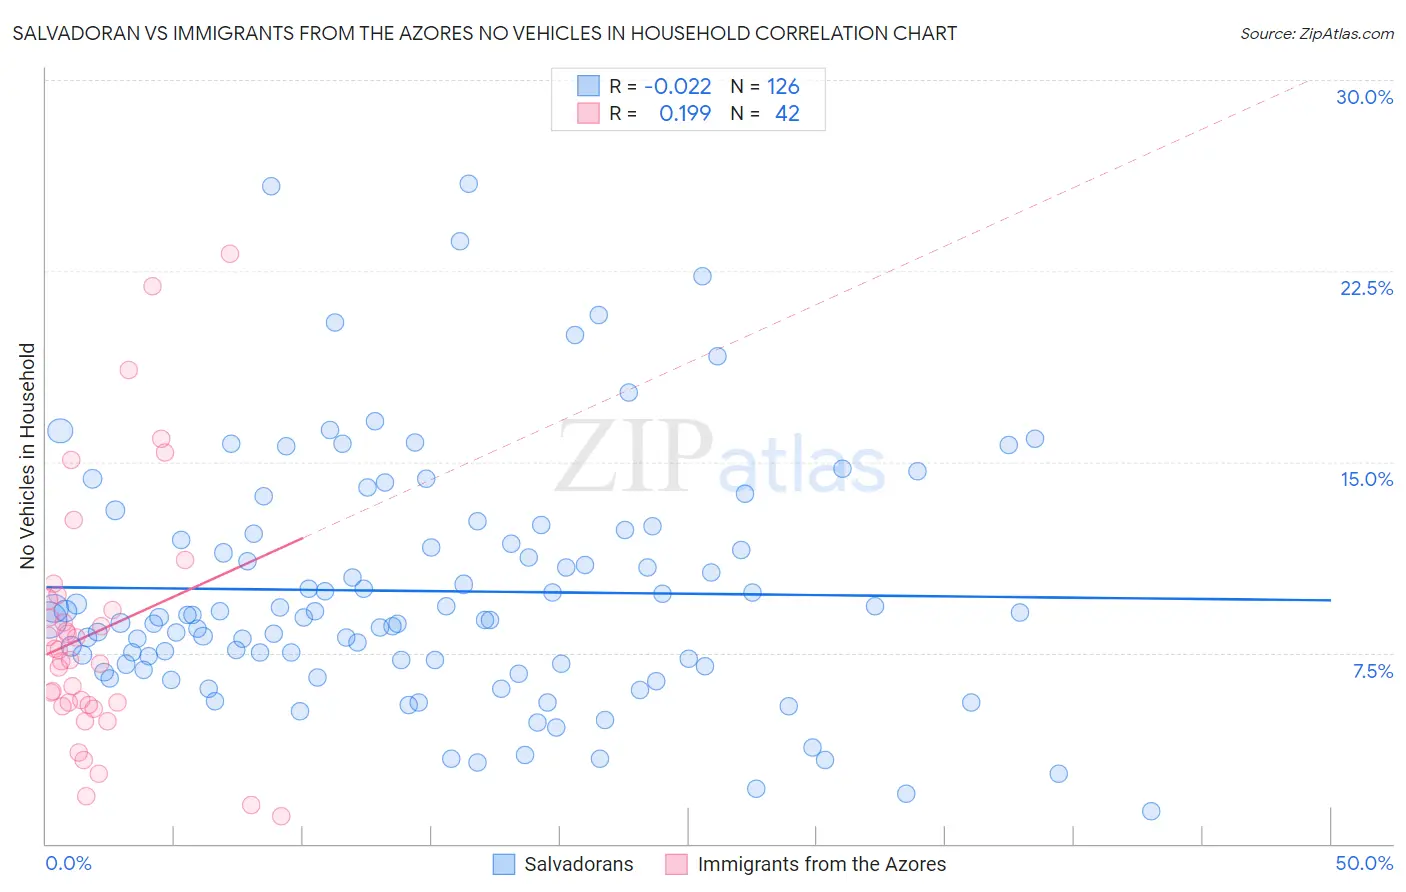
Salvadoran vs Immigrants from the Azores No Vehicles in Household Correlation Chart
The statistical analysis conducted on geographies consisting of 397,977,733 people shows no correlation between the proportion of Salvadorans and percentage of households with no vehicle available in the United States with a correlation coefficient (R) of -0.022 and weighted average of 10.1%. Similarly, the statistical analysis conducted on geographies consisting of 46,204,339 people shows a poor positive correlation between the proportion of Immigrants from the Azores and percentage of households with no vehicle available in the United States with a correlation coefficient (R) of 0.199 and weighted average of 9.7%, a difference of 3.8%.
No Vehicles in Household Correlation Summary
| Measurement | Salvadoran | Immigrants from the Azores |
| Minimum | 1.3% | 1.1% |
| Maximum | 25.9% | 23.2% |
| Range | 24.7% | 22.1% |
| Mean | 9.9% | 8.3% |
| Median | 8.9% | 7.4% |
| Interquartile 25% (IQ1) | 7.1% | 5.4% |
| Interquartile 75% (IQ3) | 12.2% | 9.6% |
| Interquartile Range (IQR) | 5.1% | 4.2% |
| Standard Deviation (Sample) | 4.8% | 5.0% |
| Standard Deviation (Population) | 4.8% | 4.9% |
Similar Demographics by No Vehicles in Household
Demographics Similar to Salvadorans by No Vehicles in Household
In terms of no vehicles in household, the demographic groups most similar to Salvadorans are Sioux (10.1%, a difference of 0.010%), Tlingit-Haida (10.1%, a difference of 0.030%), Immigrants from Congo (10.1%, a difference of 0.12%), Immigrants from Micronesia (10.1%, a difference of 0.25%), and Immigrants from Eastern Africa (10.0%, a difference of 0.26%).
| Demographics | Rating | Rank | No Vehicles in Household |
| Immigrants | Bosnia and Herzegovina | 79.1 /100 | #148 | Good 9.9% |
| Immigrants | Uganda | 76.1 /100 | #149 | Good 10.0% |
| Colombians | 73.9 /100 | #150 | Good 10.0% |
| Immigrants | Eastern Africa | 73.8 /100 | #151 | Good 10.0% |
| Immigrants | Congo | 73.0 /100 | #152 | Good 10.1% |
| Tlingit-Haida | 72.5 /100 | #153 | Good 10.1% |
| Sioux | 72.4 /100 | #154 | Good 10.1% |
| Salvadorans | 72.4 /100 | #155 | Good 10.1% |
| Immigrants | Micronesia | 70.9 /100 | #156 | Good 10.1% |
| Australians | 70.6 /100 | #157 | Good 10.1% |
| Spanish American Indians | 70.2 /100 | #158 | Good 10.1% |
| Immigrants | Indonesia | 69.3 /100 | #159 | Good 10.1% |
| Immigrants | Middle Africa | 65.7 /100 | #160 | Good 10.2% |
| New Zealanders | 65.1 /100 | #161 | Good 10.2% |
| Immigrants | Austria | 64.4 /100 | #162 | Good 10.2% |
Demographics Similar to Immigrants from the Azores by No Vehicles in Household
In terms of no vehicles in household, the demographic groups most similar to Immigrants from the Azores are Kenyan (9.7%, a difference of 0.070%), Burmese (9.7%, a difference of 0.20%), Immigrants from Oceania (9.7%, a difference of 0.37%), Syrian (9.7%, a difference of 0.39%), and Nicaraguan (9.7%, a difference of 0.46%).
| Demographics | Rating | Rank | No Vehicles in Household |
| Immigrants | Korea | 90.9 /100 | #124 | Exceptional 9.6% |
| Immigrants | Cameroon | 90.6 /100 | #125 | Exceptional 9.6% |
| Icelanders | 90.2 /100 | #126 | Exceptional 9.6% |
| Immigrants | Kenya | 89.7 /100 | #127 | Excellent 9.6% |
| Immigrants | Syria | 89.5 /100 | #128 | Excellent 9.6% |
| Nicaraguans | 89.5 /100 | #129 | Excellent 9.7% |
| Burmese | 88.8 /100 | #130 | Excellent 9.7% |
| Immigrants | Azores | 88.2 /100 | #131 | Excellent 9.7% |
| Kenyans | 88.0 /100 | #132 | Excellent 9.7% |
| Immigrants | Oceania | 87.1 /100 | #133 | Excellent 9.7% |
| Syrians | 87.1 /100 | #134 | Excellent 9.7% |
| Latvians | 85.1 /100 | #135 | Excellent 9.8% |
| Immigrants | South Africa | 85.0 /100 | #136 | Excellent 9.8% |
| Immigrants | Moldova | 84.6 /100 | #137 | Excellent 9.8% |
| Estonians | 84.2 /100 | #138 | Excellent 9.8% |