Salvadoran vs Tsimshian Female Poverty Among 18-24 Year Olds
COMPARE
Salvadoran
Tsimshian
Female Poverty Among 18-24 Year Olds
Female Poverty Among 18-24 Year Olds Comparison
Salvadorans
Tsimshian
19.1%
FEMALE POVERTY AMONG 18-24 YEAR OLDS
98.4/ 100
METRIC RATING
97th/ 347
METRIC RANK
21.2%
FEMALE POVERTY AMONG 18-24 YEAR OLDS
1.0/ 100
METRIC RATING
256th/ 347
METRIC RANK
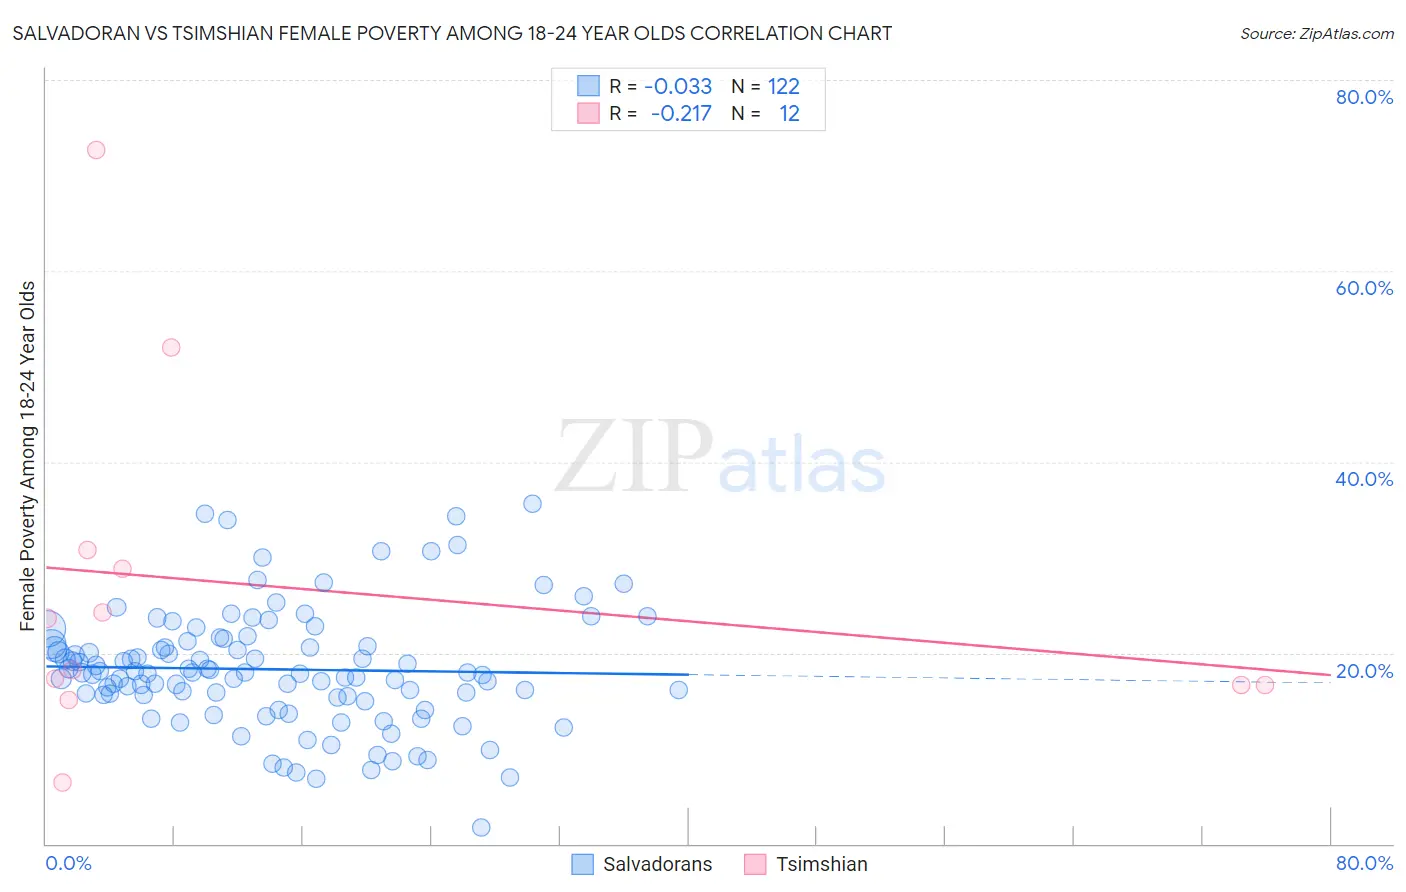
Salvadoran vs Tsimshian Female Poverty Among 18-24 Year Olds Correlation Chart
The statistical analysis conducted on geographies consisting of 390,935,430 people shows no correlation between the proportion of Salvadorans and poverty level among females between the ages 18 and 24 in the United States with a correlation coefficient (R) of -0.033 and weighted average of 19.1%. Similarly, the statistical analysis conducted on geographies consisting of 15,547,033 people shows a weak negative correlation between the proportion of Tsimshian and poverty level among females between the ages 18 and 24 in the United States with a correlation coefficient (R) of -0.217 and weighted average of 21.2%, a difference of 11.2%.
Female Poverty Among 18-24 Year Olds Correlation Summary
| Measurement | Salvadoran | Tsimshian |
| Minimum | 1.7% | 6.4% |
| Maximum | 35.6% | 72.7% |
| Range | 34.0% | 66.4% |
| Mean | 18.3% | 26.9% |
| Median | 17.9% | 20.9% |
| Interquartile 25% (IQ1) | 15.4% | 16.7% |
| Interquartile 75% (IQ3) | 20.9% | 29.8% |
| Interquartile Range (IQR) | 5.5% | 13.2% |
| Standard Deviation (Sample) | 6.2% | 18.4% |
| Standard Deviation (Population) | 6.1% | 17.6% |
Similar Demographics by Female Poverty Among 18-24 Year Olds
Demographics Similar to Salvadorans by Female Poverty Among 18-24 Year Olds
In terms of female poverty among 18-24 year olds, the demographic groups most similar to Salvadorans are Immigrants from Jordan (19.1%, a difference of 0.010%), Immigrants from Czechoslovakia (19.1%, a difference of 0.080%), Chilean (19.1%, a difference of 0.10%), Ecuadorian (19.1%, a difference of 0.19%), and Immigrants from Caribbean (19.1%, a difference of 0.21%).
| Demographics | Rating | Rank | Female Poverty Among 18-24 Year Olds |
| Afghans | 99.0 /100 | #90 | Exceptional 19.0% |
| Romanians | 98.9 /100 | #91 | Exceptional 19.0% |
| Filipinos | 98.9 /100 | #92 | Exceptional 19.0% |
| Haitians | 98.9 /100 | #93 | Exceptional 19.0% |
| Ukrainians | 98.8 /100 | #94 | Exceptional 19.0% |
| Guamanians/Chamorros | 98.8 /100 | #95 | Exceptional 19.0% |
| Sierra Leoneans | 98.7 /100 | #96 | Exceptional 19.0% |
| Salvadorans | 98.4 /100 | #97 | Exceptional 19.1% |
| Immigrants | Jordan | 98.4 /100 | #98 | Exceptional 19.1% |
| Immigrants | Czechoslovakia | 98.3 /100 | #99 | Exceptional 19.1% |
| Chileans | 98.3 /100 | #100 | Exceptional 19.1% |
| Ecuadorians | 98.1 /100 | #101 | Exceptional 19.1% |
| Immigrants | Caribbean | 98.1 /100 | #102 | Exceptional 19.1% |
| Serbians | 98.0 /100 | #103 | Exceptional 19.1% |
| Immigrants | Afghanistan | 98.0 /100 | #104 | Exceptional 19.1% |
Demographics Similar to Tsimshian by Female Poverty Among 18-24 Year Olds
In terms of female poverty among 18-24 year olds, the demographic groups most similar to Tsimshian are Taiwanese (21.2%, a difference of 0.10%), Immigrants from Grenada (21.2%, a difference of 0.15%), British West Indian (21.2%, a difference of 0.18%), Delaware (21.1%, a difference of 0.47%), and South African (21.1%, a difference of 0.52%).
| Demographics | Rating | Rank | Female Poverty Among 18-24 Year Olds |
| Carpatho Rusyns | 2.5 /100 | #249 | Tragic 21.0% |
| Immigrants | West Indies | 2.2 /100 | #250 | Tragic 21.0% |
| West Indians | 1.9 /100 | #251 | Tragic 21.1% |
| South Africans | 1.6 /100 | #252 | Tragic 21.1% |
| Delaware | 1.6 /100 | #253 | Tragic 21.1% |
| British West Indians | 1.2 /100 | #254 | Tragic 21.2% |
| Immigrants | Grenada | 1.2 /100 | #255 | Tragic 21.2% |
| Tsimshian | 1.0 /100 | #256 | Tragic 21.2% |
| Taiwanese | 1.0 /100 | #257 | Tragic 21.2% |
| Vietnamese | 0.6 /100 | #258 | Tragic 21.4% |
| Immigrants | France | 0.6 /100 | #259 | Tragic 21.4% |
| Immigrants | Norway | 0.6 /100 | #260 | Tragic 21.4% |
| Immigrants | Bahamas | 0.5 /100 | #261 | Tragic 21.4% |
| Immigrants | Eastern Africa | 0.4 /100 | #262 | Tragic 21.4% |
| Icelanders | 0.3 /100 | #263 | Tragic 21.5% |