Pueblo vs Tlingit-Haida 1 or more Vehicles in Household
COMPARE
Pueblo
Tlingit-Haida
1 or more Vehicles in Household
1 or more Vehicles in Household Comparison
Pueblo
Tlingit-Haida
89.6%
1 OR MORE VEHICLES IN HOUSEHOLD
39.9/ 100
METRIC RATING
186th/ 347
METRIC RANK
90.1%
1 OR MORE VEHICLES IN HOUSEHOLD
74.3/ 100
METRIC RATING
152nd/ 347
METRIC RANK
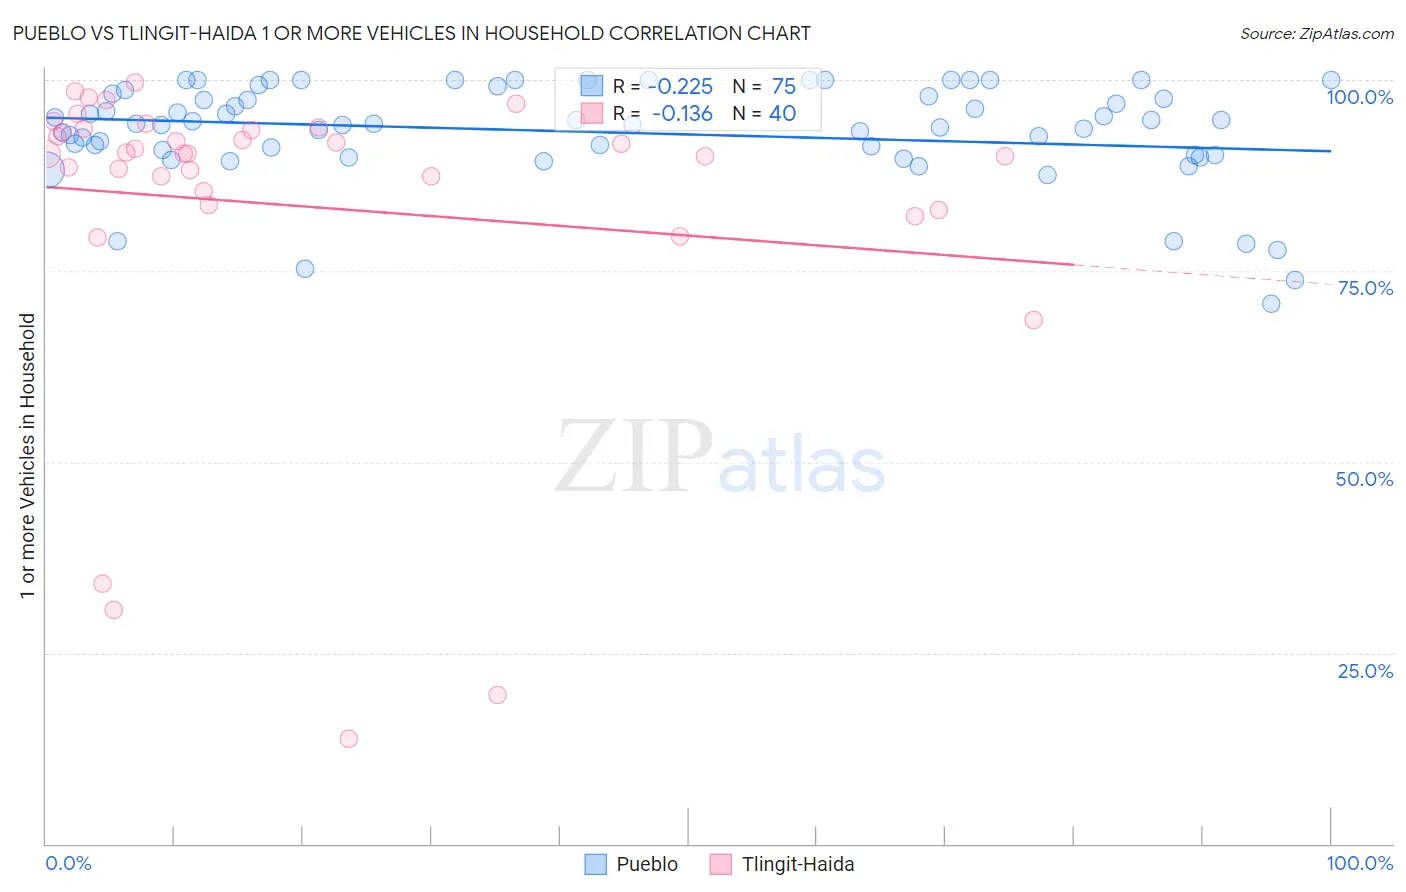
Pueblo vs Tlingit-Haida 1 or more Vehicles in Household Correlation Chart
The statistical analysis conducted on geographies consisting of 120,072,520 people shows a weak negative correlation between the proportion of Pueblo and percentage of households with 1 or more vehicles available in the United States with a correlation coefficient (R) of -0.225 and weighted average of 89.6%. Similarly, the statistical analysis conducted on geographies consisting of 60,855,419 people shows a poor negative correlation between the proportion of Tlingit-Haida and percentage of households with 1 or more vehicles available in the United States with a correlation coefficient (R) of -0.136 and weighted average of 90.1%, a difference of 0.57%.
1 or more Vehicles in Household Correlation Summary
| Measurement | Pueblo | Tlingit-Haida |
| Minimum | 70.7% | 13.7% |
| Maximum | 100.0% | 99.6% |
| Range | 29.3% | 85.9% |
| Mean | 93.2% | 83.5% |
| Median | 94.3% | 90.3% |
| Interquartile 25% (IQ1) | 90.2% | 84.6% |
| Interquartile 75% (IQ3) | 98.2% | 93.5% |
| Interquartile Range (IQR) | 7.9% | 9.0% |
| Standard Deviation (Sample) | 6.6% | 21.0% |
| Standard Deviation (Population) | 6.6% | 20.7% |
Similar Demographics by 1 or more Vehicles in Household
Demographics Similar to Pueblo by 1 or more Vehicles in Household
In terms of 1 or more vehicles in household, the demographic groups most similar to Pueblo are Immigrants from Brazil (89.6%, a difference of 0.0%), Immigrants from Bulgaria (89.6%, a difference of 0.010%), South American (89.5%, a difference of 0.010%), Ethiopian (89.6%, a difference of 0.020%), and Immigrants from Nepal (89.5%, a difference of 0.020%).
| Demographics | Rating | Rank | 1 or more Vehicles in Household |
| German Russians | 44.0 /100 | #179 | Average 89.6% |
| Arabs | 43.3 /100 | #180 | Average 89.6% |
| Immigrants | Ethiopia | 42.5 /100 | #181 | Average 89.6% |
| Ukrainians | 42.4 /100 | #182 | Average 89.6% |
| Ethiopians | 41.2 /100 | #183 | Average 89.6% |
| Immigrants | Bulgaria | 40.7 /100 | #184 | Average 89.6% |
| Immigrants | Brazil | 40.1 /100 | #185 | Average 89.6% |
| Pueblo | 39.9 /100 | #186 | Fair 89.6% |
| South Americans | 39.6 /100 | #187 | Fair 89.5% |
| Immigrants | Nepal | 38.9 /100 | #188 | Fair 89.5% |
| Carpatho Rusyns | 37.8 /100 | #189 | Fair 89.5% |
| Shoshone | 37.5 /100 | #190 | Fair 89.5% |
| Immigrants | Poland | 37.1 /100 | #191 | Fair 89.5% |
| Immigrants | North Macedonia | 36.5 /100 | #192 | Fair 89.5% |
| Immigrants | Northern Europe | 35.5 /100 | #193 | Fair 89.5% |
Demographics Similar to Tlingit-Haida by 1 or more Vehicles in Household
In terms of 1 or more vehicles in household, the demographic groups most similar to Tlingit-Haida are New Zealander (90.1%, a difference of 0.010%), Immigrants from Uganda (90.1%, a difference of 0.010%), Immigrants (90.1%, a difference of 0.010%), Immigrants from Bosnia and Herzegovina (90.1%, a difference of 0.020%), and Immigrants from Micronesia (90.1%, a difference of 0.030%).
| Demographics | Rating | Rank | 1 or more Vehicles in Household |
| Sioux | 81.3 /100 | #145 | Excellent 90.2% |
| Bahamians | 80.5 /100 | #146 | Excellent 90.2% |
| Chileans | 79.8 /100 | #147 | Good 90.2% |
| Immigrants | Eastern Africa | 78.2 /100 | #148 | Good 90.1% |
| Immigrants | Nicaragua | 76.7 /100 | #149 | Good 90.1% |
| Immigrants | Micronesia | 75.9 /100 | #150 | Good 90.1% |
| Immigrants | Bosnia and Herzegovina | 75.4 /100 | #151 | Good 90.1% |
| Tlingit-Haida | 74.3 /100 | #152 | Good 90.1% |
| New Zealanders | 73.8 /100 | #153 | Good 90.1% |
| Immigrants | Uganda | 73.8 /100 | #154 | Good 90.1% |
| Immigrants | Immigrants | 73.6 /100 | #155 | Good 90.1% |
| Australians | 72.4 /100 | #156 | Good 90.0% |
| Immigrants | Congo | 71.2 /100 | #157 | Good 90.0% |
| Brazilians | 71.0 /100 | #158 | Good 90.0% |
| South Africans | 69.7 /100 | #159 | Good 90.0% |