Immigrants from Kenya vs Tlingit-Haida 1 or more Vehicles in Household
COMPARE
Immigrants from Kenya
Tlingit-Haida
1 or more Vehicles in Household
1 or more Vehicles in Household Comparison
Immigrants from Kenya
Tlingit-Haida
90.4%
1 OR MORE VEHICLES IN HOUSEHOLD
88.5/ 100
METRIC RATING
131st/ 347
METRIC RANK
90.1%
1 OR MORE VEHICLES IN HOUSEHOLD
74.3/ 100
METRIC RATING
152nd/ 347
METRIC RANK
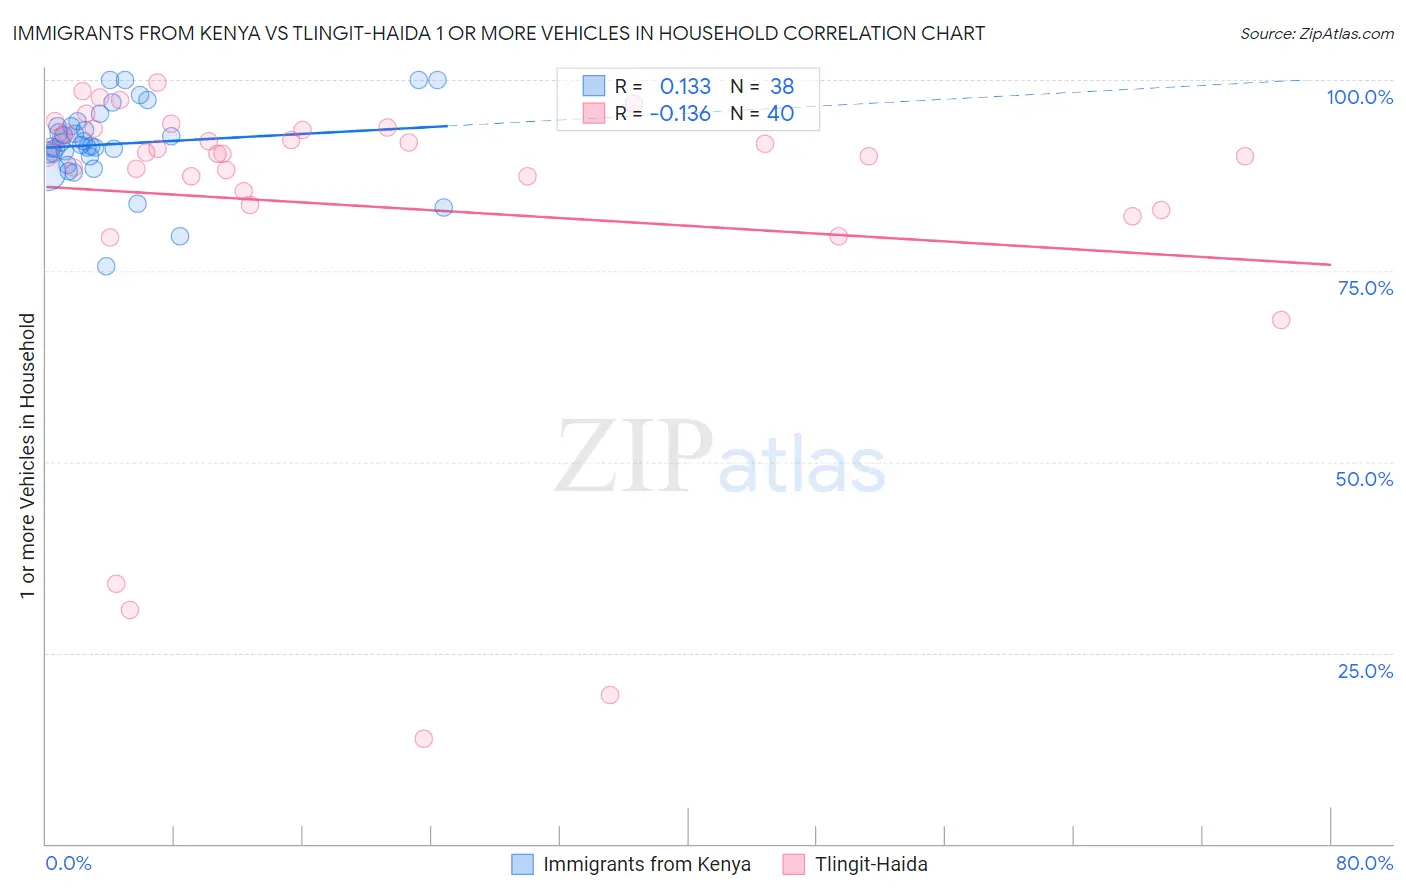
Immigrants from Kenya vs Tlingit-Haida 1 or more Vehicles in Household Correlation Chart
The statistical analysis conducted on geographies consisting of 217,997,711 people shows a poor positive correlation between the proportion of Immigrants from Kenya and percentage of households with 1 or more vehicles available in the United States with a correlation coefficient (R) of 0.133 and weighted average of 90.4%. Similarly, the statistical analysis conducted on geographies consisting of 60,855,419 people shows a poor negative correlation between the proportion of Tlingit-Haida and percentage of households with 1 or more vehicles available in the United States with a correlation coefficient (R) of -0.136 and weighted average of 90.1%, a difference of 0.38%.
1 or more Vehicles in Household Correlation Summary
| Measurement | Immigrants from Kenya | Tlingit-Haida |
| Minimum | 75.6% | 13.7% |
| Maximum | 100.0% | 99.6% |
| Range | 24.4% | 85.9% |
| Mean | 91.6% | 83.5% |
| Median | 91.4% | 90.3% |
| Interquartile 25% (IQ1) | 89.9% | 84.6% |
| Interquartile 75% (IQ3) | 94.0% | 93.5% |
| Interquartile Range (IQR) | 4.1% | 9.0% |
| Standard Deviation (Sample) | 5.3% | 21.0% |
| Standard Deviation (Population) | 5.2% | 20.7% |
Similar Demographics by 1 or more Vehicles in Household
Demographics Similar to Immigrants from Kenya by 1 or more Vehicles in Household
In terms of 1 or more vehicles in household, the demographic groups most similar to Immigrants from Kenya are Nicaraguan (90.4%, a difference of 0.010%), Immigrants from South Africa (90.4%, a difference of 0.010%), Immigrants from the Azores (90.4%, a difference of 0.020%), Burmese (90.4%, a difference of 0.020%), and Marshallese (90.4%, a difference of 0.020%).
| Demographics | Rating | Rank | 1 or more Vehicles in Household |
| Puget Sound Salish | 91.5 /100 | #124 | Exceptional 90.5% |
| Immigrants | Korea | 90.5 /100 | #125 | Exceptional 90.5% |
| Immigrants | Cameroon | 89.4 /100 | #126 | Excellent 90.4% |
| Immigrants | Azores | 89.1 /100 | #127 | Excellent 90.4% |
| Burmese | 89.0 /100 | #128 | Excellent 90.4% |
| Marshallese | 88.9 /100 | #129 | Excellent 90.4% |
| Nicaraguans | 88.8 /100 | #130 | Excellent 90.4% |
| Immigrants | Kenya | 88.5 /100 | #131 | Excellent 90.4% |
| Immigrants | South Africa | 88.1 /100 | #132 | Excellent 90.4% |
| Immigrants | Syria | 87.5 /100 | #133 | Excellent 90.4% |
| Kenyans | 87.0 /100 | #134 | Excellent 90.4% |
| Immigrants | Oceania | 86.9 /100 | #135 | Excellent 90.4% |
| Hungarians | 86.5 /100 | #136 | Excellent 90.3% |
| Latvians | 86.3 /100 | #137 | Excellent 90.3% |
| Syrians | 86.3 /100 | #138 | Excellent 90.3% |
Demographics Similar to Tlingit-Haida by 1 or more Vehicles in Household
In terms of 1 or more vehicles in household, the demographic groups most similar to Tlingit-Haida are New Zealander (90.1%, a difference of 0.010%), Immigrants from Uganda (90.1%, a difference of 0.010%), Immigrants (90.1%, a difference of 0.010%), Immigrants from Bosnia and Herzegovina (90.1%, a difference of 0.020%), and Immigrants from Micronesia (90.1%, a difference of 0.030%).
| Demographics | Rating | Rank | 1 or more Vehicles in Household |
| Sioux | 81.3 /100 | #145 | Excellent 90.2% |
| Bahamians | 80.5 /100 | #146 | Excellent 90.2% |
| Chileans | 79.8 /100 | #147 | Good 90.2% |
| Immigrants | Eastern Africa | 78.2 /100 | #148 | Good 90.1% |
| Immigrants | Nicaragua | 76.7 /100 | #149 | Good 90.1% |
| Immigrants | Micronesia | 75.9 /100 | #150 | Good 90.1% |
| Immigrants | Bosnia and Herzegovina | 75.4 /100 | #151 | Good 90.1% |
| Tlingit-Haida | 74.3 /100 | #152 | Good 90.1% |
| New Zealanders | 73.8 /100 | #153 | Good 90.1% |
| Immigrants | Uganda | 73.8 /100 | #154 | Good 90.1% |
| Immigrants | Immigrants | 73.6 /100 | #155 | Good 90.1% |
| Australians | 72.4 /100 | #156 | Good 90.0% |
| Immigrants | Congo | 71.2 /100 | #157 | Good 90.0% |
| Brazilians | 71.0 /100 | #158 | Good 90.0% |
| South Africans | 69.7 /100 | #159 | Good 90.0% |