Pueblo vs Belizean 1 or more Vehicles in Household
COMPARE
Pueblo
Belizean
1 or more Vehicles in Household
1 or more Vehicles in Household Comparison
Pueblo
Belizeans
89.6%
1 OR MORE VEHICLES IN HOUSEHOLD
39.9/ 100
METRIC RATING
186th/ 347
METRIC RANK
85.7%
1 OR MORE VEHICLES IN HOUSEHOLD
0.0/ 100
METRIC RATING
298th/ 347
METRIC RANK
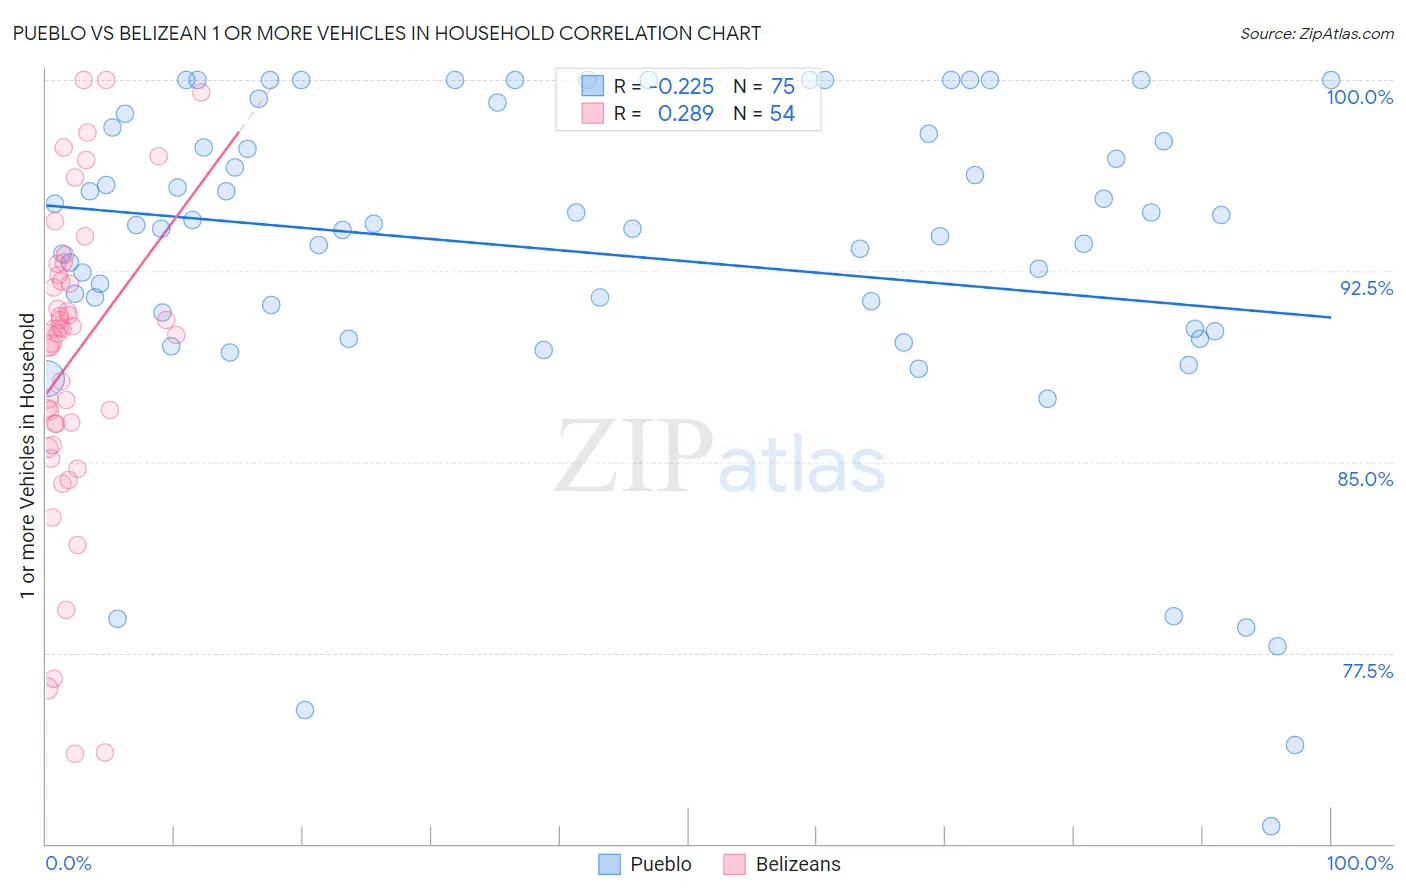
Pueblo vs Belizean 1 or more Vehicles in Household Correlation Chart
The statistical analysis conducted on geographies consisting of 120,072,520 people shows a weak negative correlation between the proportion of Pueblo and percentage of households with 1 or more vehicles available in the United States with a correlation coefficient (R) of -0.225 and weighted average of 89.6%. Similarly, the statistical analysis conducted on geographies consisting of 144,165,172 people shows a weak positive correlation between the proportion of Belizeans and percentage of households with 1 or more vehicles available in the United States with a correlation coefficient (R) of 0.289 and weighted average of 85.7%, a difference of 4.5%.
1 or more Vehicles in Household Correlation Summary
| Measurement | Pueblo | Belizean |
| Minimum | 70.7% | 73.5% |
| Maximum | 100.0% | 100.0% |
| Range | 29.3% | 26.5% |
| Mean | 93.2% | 89.1% |
| Median | 94.3% | 90.1% |
| Interquartile 25% (IQ1) | 90.2% | 86.5% |
| Interquartile 75% (IQ3) | 98.2% | 92.4% |
| Interquartile Range (IQR) | 7.9% | 5.9% |
| Standard Deviation (Sample) | 6.6% | 6.1% |
| Standard Deviation (Population) | 6.6% | 6.0% |
Similar Demographics by 1 or more Vehicles in Household
Demographics Similar to Pueblo by 1 or more Vehicles in Household
In terms of 1 or more vehicles in household, the demographic groups most similar to Pueblo are Immigrants from Brazil (89.6%, a difference of 0.0%), Immigrants from Bulgaria (89.6%, a difference of 0.010%), South American (89.5%, a difference of 0.010%), Ethiopian (89.6%, a difference of 0.020%), and Immigrants from Nepal (89.5%, a difference of 0.020%).
| Demographics | Rating | Rank | 1 or more Vehicles in Household |
| German Russians | 44.0 /100 | #179 | Average 89.6% |
| Arabs | 43.3 /100 | #180 | Average 89.6% |
| Immigrants | Ethiopia | 42.5 /100 | #181 | Average 89.6% |
| Ukrainians | 42.4 /100 | #182 | Average 89.6% |
| Ethiopians | 41.2 /100 | #183 | Average 89.6% |
| Immigrants | Bulgaria | 40.7 /100 | #184 | Average 89.6% |
| Immigrants | Brazil | 40.1 /100 | #185 | Average 89.6% |
| Pueblo | 39.9 /100 | #186 | Fair 89.6% |
| South Americans | 39.6 /100 | #187 | Fair 89.5% |
| Immigrants | Nepal | 38.9 /100 | #188 | Fair 89.5% |
| Carpatho Rusyns | 37.8 /100 | #189 | Fair 89.5% |
| Shoshone | 37.5 /100 | #190 | Fair 89.5% |
| Immigrants | Poland | 37.1 /100 | #191 | Fair 89.5% |
| Immigrants | North Macedonia | 36.5 /100 | #192 | Fair 89.5% |
| Immigrants | Northern Europe | 35.5 /100 | #193 | Fair 89.5% |
Demographics Similar to Belizeans by 1 or more Vehicles in Household
In terms of 1 or more vehicles in household, the demographic groups most similar to Belizeans are Paraguayan (85.7%, a difference of 0.080%), Immigrants from Spain (85.8%, a difference of 0.17%), Immigrants from Jamaica (85.8%, a difference of 0.20%), Yuman (85.5%, a difference of 0.24%), and Immigrants from Russia (85.4%, a difference of 0.25%).
| Demographics | Rating | Rank | 1 or more Vehicles in Household |
| Pima | 0.0 /100 | #291 | Tragic 86.3% |
| Okinawans | 0.0 /100 | #292 | Tragic 86.1% |
| Indians (Asian) | 0.0 /100 | #293 | Tragic 86.0% |
| Alaskan Athabascans | 0.0 /100 | #294 | Tragic 86.0% |
| Immigrants | Jamaica | 0.0 /100 | #295 | Tragic 85.8% |
| Immigrants | Spain | 0.0 /100 | #296 | Tragic 85.8% |
| Paraguayans | 0.0 /100 | #297 | Tragic 85.7% |
| Belizeans | 0.0 /100 | #298 | Tragic 85.7% |
| Yuman | 0.0 /100 | #299 | Tragic 85.5% |
| Immigrants | Russia | 0.0 /100 | #300 | Tragic 85.4% |
| Immigrants | Panama | 0.0 /100 | #301 | Tragic 85.4% |
| Moroccans | 0.0 /100 | #302 | Tragic 85.4% |
| Immigrants | Greece | 0.0 /100 | #303 | Tragic 85.4% |
| Immigrants | Ukraine | 0.0 /100 | #304 | Tragic 85.2% |
| Immigrants | China | 0.0 /100 | #305 | Tragic 84.9% |