Immigrants from Serbia vs Tlingit-Haida 1 or more Vehicles in Household
COMPARE
Immigrants from Serbia
Tlingit-Haida
1 or more Vehicles in Household
1 or more Vehicles in Household Comparison
Immigrants from Serbia
Tlingit-Haida
88.2%
1 OR MORE VEHICLES IN HOUSEHOLD
1.2/ 100
METRIC RATING
251st/ 347
METRIC RANK
90.1%
1 OR MORE VEHICLES IN HOUSEHOLD
74.3/ 100
METRIC RATING
152nd/ 347
METRIC RANK
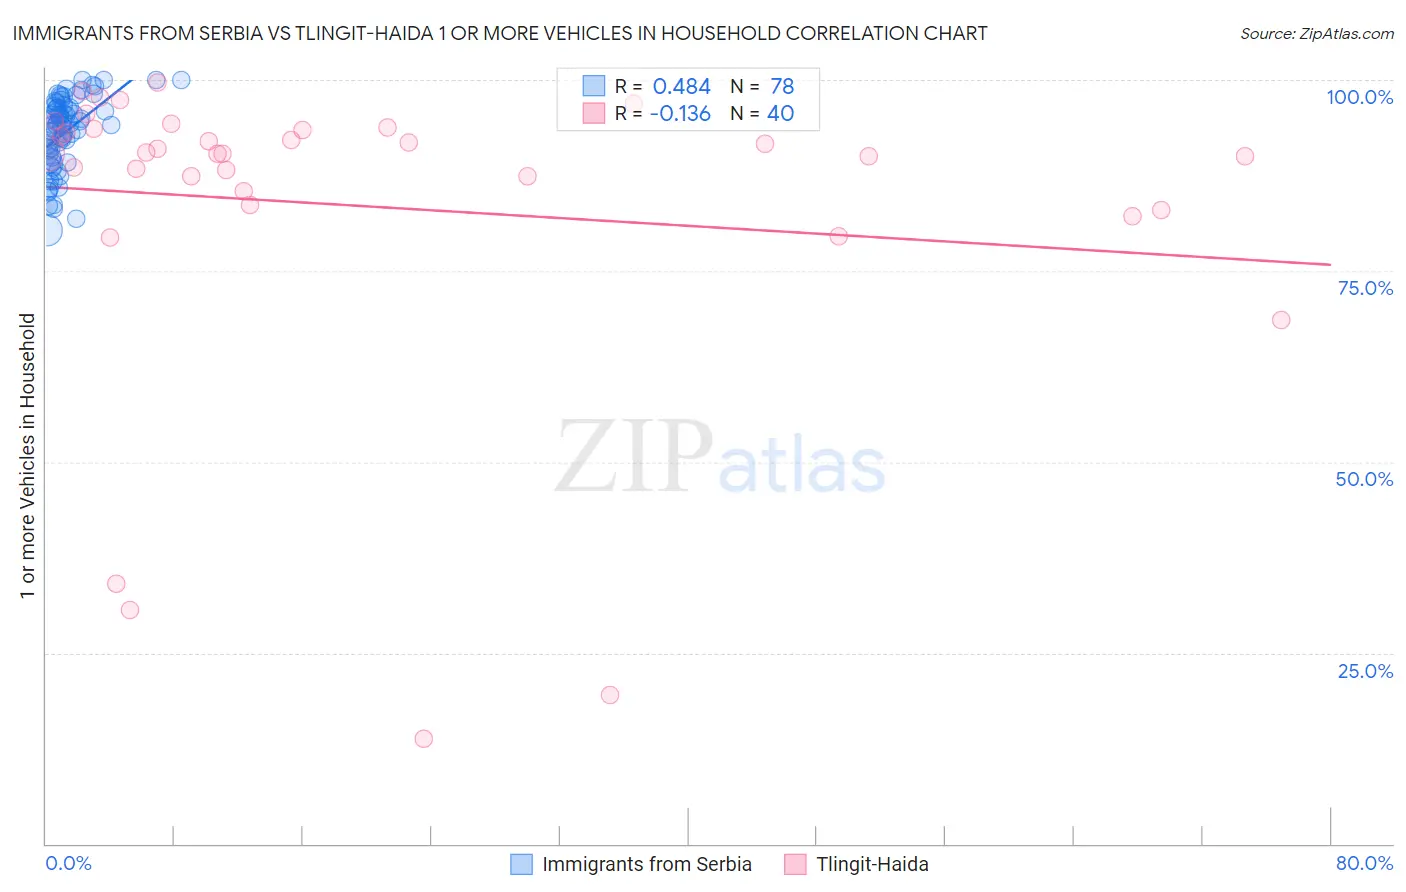
Immigrants from Serbia vs Tlingit-Haida 1 or more Vehicles in Household Correlation Chart
The statistical analysis conducted on geographies consisting of 131,404,441 people shows a moderate positive correlation between the proportion of Immigrants from Serbia and percentage of households with 1 or more vehicles available in the United States with a correlation coefficient (R) of 0.484 and weighted average of 88.2%. Similarly, the statistical analysis conducted on geographies consisting of 60,855,419 people shows a poor negative correlation between the proportion of Tlingit-Haida and percentage of households with 1 or more vehicles available in the United States with a correlation coefficient (R) of -0.136 and weighted average of 90.1%, a difference of 2.2%.
1 or more Vehicles in Household Correlation Summary
| Measurement | Immigrants from Serbia | Tlingit-Haida |
| Minimum | 80.3% | 13.7% |
| Maximum | 100.0% | 99.6% |
| Range | 19.7% | 85.9% |
| Mean | 93.2% | 83.5% |
| Median | 94.2% | 90.3% |
| Interquartile 25% (IQ1) | 90.3% | 84.6% |
| Interquartile 75% (IQ3) | 96.4% | 93.5% |
| Interquartile Range (IQR) | 6.1% | 9.0% |
| Standard Deviation (Sample) | 4.7% | 21.0% |
| Standard Deviation (Population) | 4.7% | 20.7% |
Similar Demographics by 1 or more Vehicles in Household
Demographics Similar to Immigrants from Serbia by 1 or more Vehicles in Household
In terms of 1 or more vehicles in household, the demographic groups most similar to Immigrants from Serbia are Egyptian (88.2%, a difference of 0.010%), Black/African American (88.2%, a difference of 0.050%), Immigrants from Uruguay (88.1%, a difference of 0.050%), Honduran (88.1%, a difference of 0.090%), and Immigrants from Nigeria (88.2%, a difference of 0.10%).
| Demographics | Rating | Rank | 1 or more Vehicles in Household |
| Immigrants | Portugal | 2.0 /100 | #244 | Tragic 88.3% |
| Immigrants | Czechoslovakia | 1.9 /100 | #245 | Tragic 88.3% |
| Menominee | 1.9 /100 | #246 | Tragic 88.3% |
| Immigrants | Honduras | 1.7 /100 | #247 | Tragic 88.3% |
| Immigrants | Nigeria | 1.5 /100 | #248 | Tragic 88.2% |
| Blacks/African Americans | 1.4 /100 | #249 | Tragic 88.2% |
| Egyptians | 1.2 /100 | #250 | Tragic 88.2% |
| Immigrants | Serbia | 1.2 /100 | #251 | Tragic 88.2% |
| Immigrants | Uruguay | 1.1 /100 | #252 | Tragic 88.1% |
| Hondurans | 1.0 /100 | #253 | Tragic 88.1% |
| Haitians | 0.9 /100 | #254 | Tragic 88.1% |
| Immigrants | Latvia | 0.9 /100 | #255 | Tragic 88.1% |
| Colombians | 0.9 /100 | #256 | Tragic 88.0% |
| Liberians | 0.9 /100 | #257 | Tragic 88.0% |
| South American Indians | 0.9 /100 | #258 | Tragic 88.0% |
Demographics Similar to Tlingit-Haida by 1 or more Vehicles in Household
In terms of 1 or more vehicles in household, the demographic groups most similar to Tlingit-Haida are New Zealander (90.1%, a difference of 0.010%), Immigrants from Uganda (90.1%, a difference of 0.010%), Immigrants (90.1%, a difference of 0.010%), Immigrants from Bosnia and Herzegovina (90.1%, a difference of 0.020%), and Immigrants from Micronesia (90.1%, a difference of 0.030%).
| Demographics | Rating | Rank | 1 or more Vehicles in Household |
| Sioux | 81.3 /100 | #145 | Excellent 90.2% |
| Bahamians | 80.5 /100 | #146 | Excellent 90.2% |
| Chileans | 79.8 /100 | #147 | Good 90.2% |
| Immigrants | Eastern Africa | 78.2 /100 | #148 | Good 90.1% |
| Immigrants | Nicaragua | 76.7 /100 | #149 | Good 90.1% |
| Immigrants | Micronesia | 75.9 /100 | #150 | Good 90.1% |
| Immigrants | Bosnia and Herzegovina | 75.4 /100 | #151 | Good 90.1% |
| Tlingit-Haida | 74.3 /100 | #152 | Good 90.1% |
| New Zealanders | 73.8 /100 | #153 | Good 90.1% |
| Immigrants | Uganda | 73.8 /100 | #154 | Good 90.1% |
| Immigrants | Immigrants | 73.6 /100 | #155 | Good 90.1% |
| Australians | 72.4 /100 | #156 | Good 90.0% |
| Immigrants | Congo | 71.2 /100 | #157 | Good 90.0% |
| Brazilians | 71.0 /100 | #158 | Good 90.0% |
| South Africans | 69.7 /100 | #159 | Good 90.0% |