Pueblo vs Immigrants from Oceania 1 or more Vehicles in Household
COMPARE
Pueblo
Immigrants from Oceania
1 or more Vehicles in Household
1 or more Vehicles in Household Comparison
Pueblo
Immigrants from Oceania
89.6%
1 OR MORE VEHICLES IN HOUSEHOLD
39.9/ 100
METRIC RATING
186th/ 347
METRIC RANK
90.4%
1 OR MORE VEHICLES IN HOUSEHOLD
86.9/ 100
METRIC RATING
135th/ 347
METRIC RANK
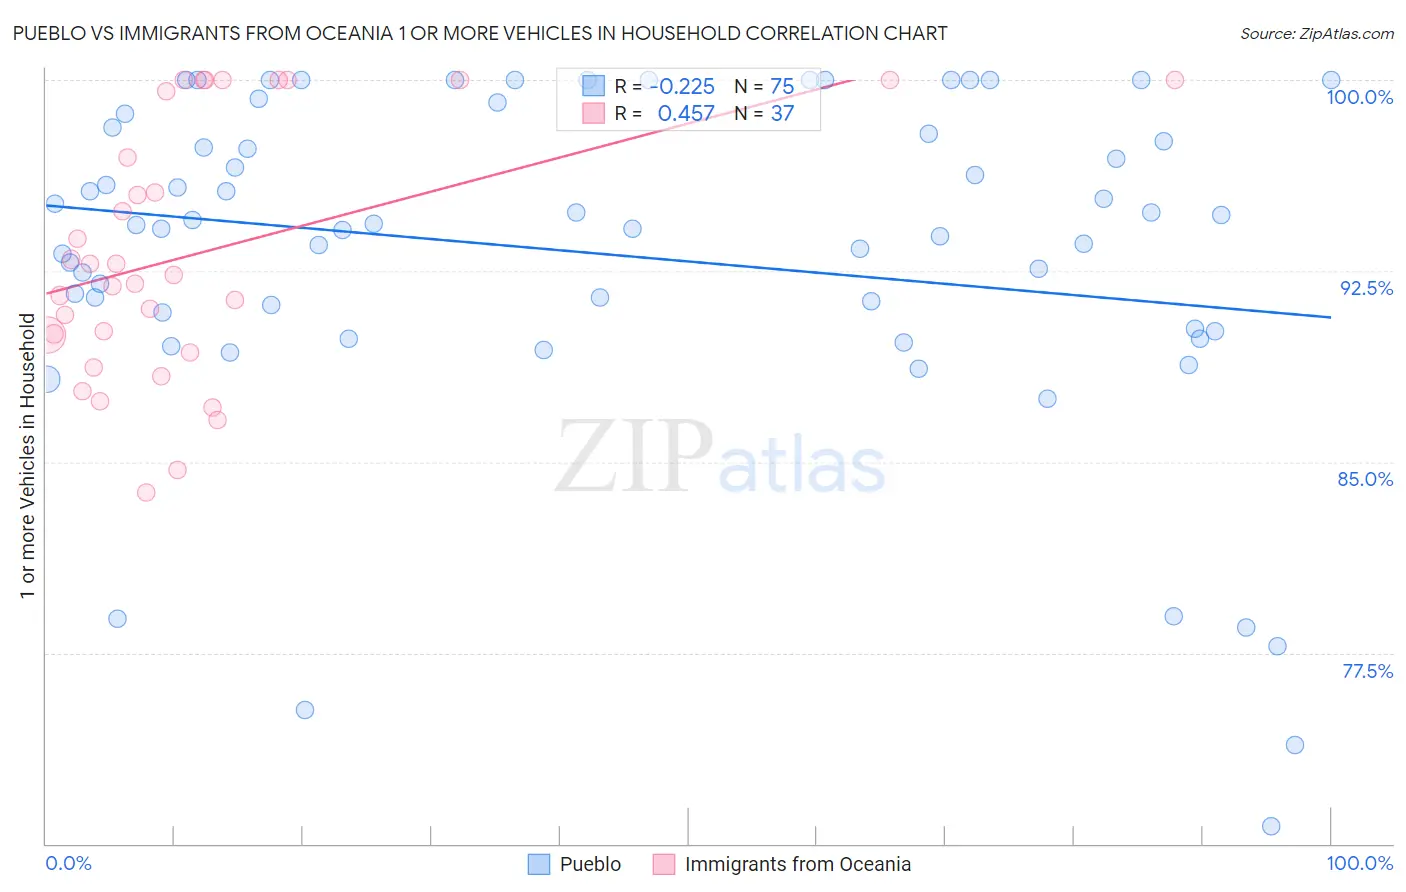
Pueblo vs Immigrants from Oceania 1 or more Vehicles in Household Correlation Chart
The statistical analysis conducted on geographies consisting of 120,072,520 people shows a weak negative correlation between the proportion of Pueblo and percentage of households with 1 or more vehicles available in the United States with a correlation coefficient (R) of -0.225 and weighted average of 89.6%. Similarly, the statistical analysis conducted on geographies consisting of 305,395,029 people shows a moderate positive correlation between the proportion of Immigrants from Oceania and percentage of households with 1 or more vehicles available in the United States with a correlation coefficient (R) of 0.457 and weighted average of 90.4%, a difference of 0.90%.
1 or more Vehicles in Household Correlation Summary
| Measurement | Pueblo | Immigrants from Oceania |
| Minimum | 70.7% | 83.8% |
| Maximum | 100.0% | 100.0% |
| Range | 29.3% | 16.2% |
| Mean | 93.2% | 93.2% |
| Median | 94.3% | 92.4% |
| Interquartile 25% (IQ1) | 90.2% | 89.6% |
| Interquartile 75% (IQ3) | 98.2% | 99.8% |
| Interquartile Range (IQR) | 7.9% | 10.2% |
| Standard Deviation (Sample) | 6.6% | 5.0% |
| Standard Deviation (Population) | 6.6% | 4.9% |
Similar Demographics by 1 or more Vehicles in Household
Demographics Similar to Pueblo by 1 or more Vehicles in Household
In terms of 1 or more vehicles in household, the demographic groups most similar to Pueblo are Immigrants from Brazil (89.6%, a difference of 0.0%), Immigrants from Bulgaria (89.6%, a difference of 0.010%), South American (89.5%, a difference of 0.010%), Ethiopian (89.6%, a difference of 0.020%), and Immigrants from Nepal (89.5%, a difference of 0.020%).
| Demographics | Rating | Rank | 1 or more Vehicles in Household |
| German Russians | 44.0 /100 | #179 | Average 89.6% |
| Arabs | 43.3 /100 | #180 | Average 89.6% |
| Immigrants | Ethiopia | 42.5 /100 | #181 | Average 89.6% |
| Ukrainians | 42.4 /100 | #182 | Average 89.6% |
| Ethiopians | 41.2 /100 | #183 | Average 89.6% |
| Immigrants | Bulgaria | 40.7 /100 | #184 | Average 89.6% |
| Immigrants | Brazil | 40.1 /100 | #185 | Average 89.6% |
| Pueblo | 39.9 /100 | #186 | Fair 89.6% |
| South Americans | 39.6 /100 | #187 | Fair 89.5% |
| Immigrants | Nepal | 38.9 /100 | #188 | Fair 89.5% |
| Carpatho Rusyns | 37.8 /100 | #189 | Fair 89.5% |
| Shoshone | 37.5 /100 | #190 | Fair 89.5% |
| Immigrants | Poland | 37.1 /100 | #191 | Fair 89.5% |
| Immigrants | North Macedonia | 36.5 /100 | #192 | Fair 89.5% |
| Immigrants | Northern Europe | 35.5 /100 | #193 | Fair 89.5% |
Demographics Similar to Immigrants from Oceania by 1 or more Vehicles in Household
In terms of 1 or more vehicles in household, the demographic groups most similar to Immigrants from Oceania are Kenyan (90.4%, a difference of 0.0%), Immigrants from Syria (90.4%, a difference of 0.020%), Hungarian (90.3%, a difference of 0.020%), Latvian (90.3%, a difference of 0.020%), and Syrian (90.3%, a difference of 0.020%).
| Demographics | Rating | Rank | 1 or more Vehicles in Household |
| Burmese | 89.0 /100 | #128 | Excellent 90.4% |
| Marshallese | 88.9 /100 | #129 | Excellent 90.4% |
| Nicaraguans | 88.8 /100 | #130 | Excellent 90.4% |
| Immigrants | Kenya | 88.5 /100 | #131 | Excellent 90.4% |
| Immigrants | South Africa | 88.1 /100 | #132 | Excellent 90.4% |
| Immigrants | Syria | 87.5 /100 | #133 | Excellent 90.4% |
| Kenyans | 87.0 /100 | #134 | Excellent 90.4% |
| Immigrants | Oceania | 86.9 /100 | #135 | Excellent 90.4% |
| Hungarians | 86.5 /100 | #136 | Excellent 90.3% |
| Latvians | 86.3 /100 | #137 | Excellent 90.3% |
| Syrians | 86.3 /100 | #138 | Excellent 90.3% |
| Estonians | 85.6 /100 | #139 | Excellent 90.3% |
| Sudanese | 85.2 /100 | #140 | Excellent 90.3% |
| Immigrants | Moldova | 83.1 /100 | #141 | Excellent 90.2% |
| Immigrants | Lithuania | 83.0 /100 | #142 | Excellent 90.2% |