Pueblo vs Immigrants from Eastern Europe 1 or more Vehicles in Household
COMPARE
Pueblo
Immigrants from Eastern Europe
1 or more Vehicles in Household
1 or more Vehicles in Household Comparison
Pueblo
Immigrants from Eastern Europe
89.6%
1 OR MORE VEHICLES IN HOUSEHOLD
39.9/ 100
METRIC RATING
186th/ 347
METRIC RANK
86.7%
1 OR MORE VEHICLES IN HOUSEHOLD
0.0/ 100
METRIC RATING
283rd/ 347
METRIC RANK
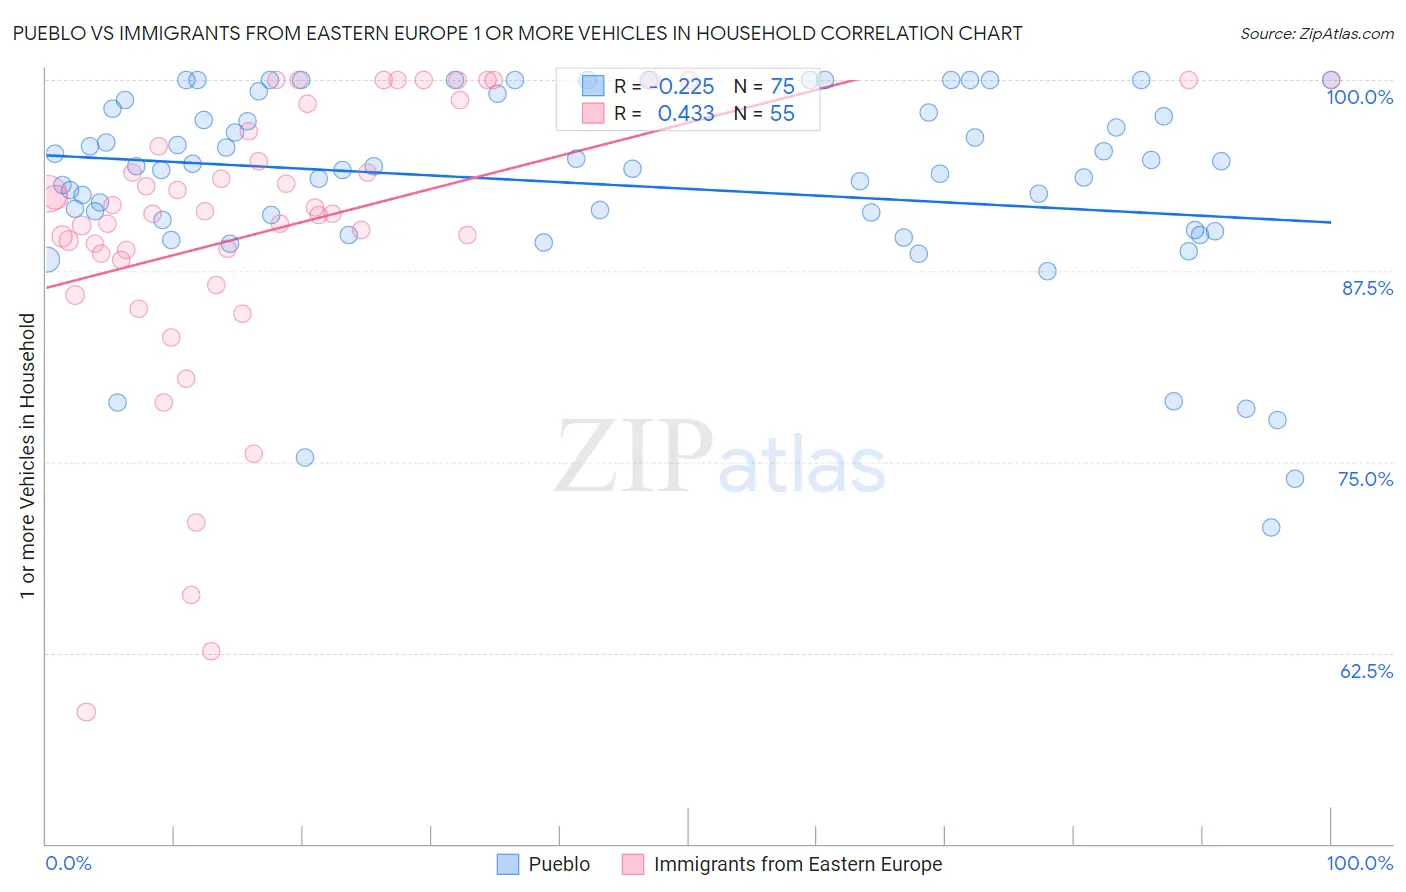
Pueblo vs Immigrants from Eastern Europe 1 or more Vehicles in Household Correlation Chart
The statistical analysis conducted on geographies consisting of 120,072,520 people shows a weak negative correlation between the proportion of Pueblo and percentage of households with 1 or more vehicles available in the United States with a correlation coefficient (R) of -0.225 and weighted average of 89.6%. Similarly, the statistical analysis conducted on geographies consisting of 475,429,921 people shows a moderate positive correlation between the proportion of Immigrants from Eastern Europe and percentage of households with 1 or more vehicles available in the United States with a correlation coefficient (R) of 0.433 and weighted average of 86.7%, a difference of 3.2%.
1 or more Vehicles in Household Correlation Summary
| Measurement | Pueblo | Immigrants from Eastern Europe |
| Minimum | 70.7% | 58.6% |
| Maximum | 100.0% | 100.0% |
| Range | 29.3% | 41.4% |
| Mean | 93.2% | 90.4% |
| Median | 94.3% | 91.4% |
| Interquartile 25% (IQ1) | 90.2% | 88.6% |
| Interquartile 75% (IQ3) | 98.2% | 98.5% |
| Interquartile Range (IQR) | 7.9% | 9.8% |
| Standard Deviation (Sample) | 6.6% | 9.4% |
| Standard Deviation (Population) | 6.6% | 9.3% |
Similar Demographics by 1 or more Vehicles in Household
Demographics Similar to Pueblo by 1 or more Vehicles in Household
In terms of 1 or more vehicles in household, the demographic groups most similar to Pueblo are Immigrants from Brazil (89.6%, a difference of 0.0%), Immigrants from Bulgaria (89.6%, a difference of 0.010%), South American (89.5%, a difference of 0.010%), Ethiopian (89.6%, a difference of 0.020%), and Immigrants from Nepal (89.5%, a difference of 0.020%).
| Demographics | Rating | Rank | 1 or more Vehicles in Household |
| German Russians | 44.0 /100 | #179 | Average 89.6% |
| Arabs | 43.3 /100 | #180 | Average 89.6% |
| Immigrants | Ethiopia | 42.5 /100 | #181 | Average 89.6% |
| Ukrainians | 42.4 /100 | #182 | Average 89.6% |
| Ethiopians | 41.2 /100 | #183 | Average 89.6% |
| Immigrants | Bulgaria | 40.7 /100 | #184 | Average 89.6% |
| Immigrants | Brazil | 40.1 /100 | #185 | Average 89.6% |
| Pueblo | 39.9 /100 | #186 | Fair 89.6% |
| South Americans | 39.6 /100 | #187 | Fair 89.5% |
| Immigrants | Nepal | 38.9 /100 | #188 | Fair 89.5% |
| Carpatho Rusyns | 37.8 /100 | #189 | Fair 89.5% |
| Shoshone | 37.5 /100 | #190 | Fair 89.5% |
| Immigrants | Poland | 37.1 /100 | #191 | Fair 89.5% |
| Immigrants | North Macedonia | 36.5 /100 | #192 | Fair 89.5% |
| Immigrants | Northern Europe | 35.5 /100 | #193 | Fair 89.5% |
Demographics Similar to Immigrants from Eastern Europe by 1 or more Vehicles in Household
In terms of 1 or more vehicles in household, the demographic groups most similar to Immigrants from Eastern Europe are Central American Indian (86.7%, a difference of 0.0%), Colville (86.8%, a difference of 0.040%), Immigrants from Kazakhstan (86.6%, a difference of 0.21%), Immigrants from Eastern Asia (86.5%, a difference of 0.24%), and Mongolian (87.0%, a difference of 0.27%).
| Demographics | Rating | Rank | 1 or more Vehicles in Household |
| Immigrants | France | 0.1 /100 | #276 | Tragic 87.1% |
| Alsatians | 0.1 /100 | #277 | Tragic 87.1% |
| Immigrants | Southern Europe | 0.1 /100 | #278 | Tragic 87.1% |
| Immigrants | Albania | 0.1 /100 | #279 | Tragic 87.1% |
| Immigrants | Croatia | 0.0 /100 | #280 | Tragic 87.0% |
| Mongolians | 0.0 /100 | #281 | Tragic 87.0% |
| Colville | 0.0 /100 | #282 | Tragic 86.8% |
| Immigrants | Eastern Europe | 0.0 /100 | #283 | Tragic 86.7% |
| Central American Indians | 0.0 /100 | #284 | Tragic 86.7% |
| Immigrants | Kazakhstan | 0.0 /100 | #285 | Tragic 86.6% |
| Immigrants | Eastern Asia | 0.0 /100 | #286 | Tragic 86.5% |
| Immigrants | Malaysia | 0.0 /100 | #287 | Tragic 86.5% |
| Hopi | 0.0 /100 | #288 | Tragic 86.4% |
| Immigrants | Ireland | 0.0 /100 | #289 | Tragic 86.4% |
| Immigrants | Australia | 0.0 /100 | #290 | Tragic 86.4% |