Scottish vs Tlingit-Haida 1 or more Vehicles in Household
COMPARE
Scottish
Tlingit-Haida
1 or more Vehicles in Household
1 or more Vehicles in Household Comparison
Scottish
Tlingit-Haida
93.4%
1 OR MORE VEHICLES IN HOUSEHOLD
100.0/ 100
METRIC RATING
7th/ 347
METRIC RANK
90.1%
1 OR MORE VEHICLES IN HOUSEHOLD
74.3/ 100
METRIC RATING
152nd/ 347
METRIC RANK
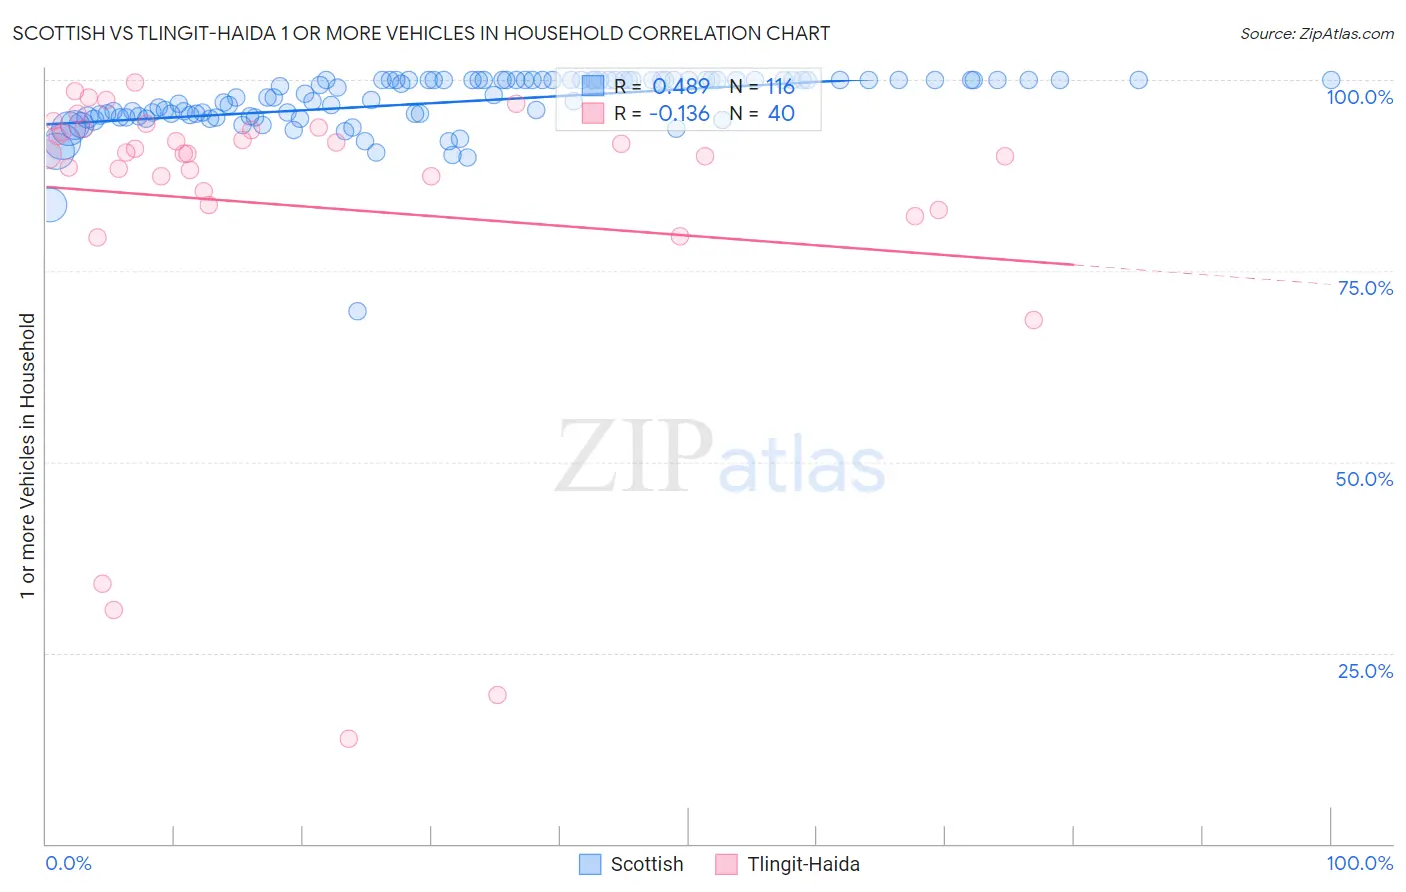
Scottish vs Tlingit-Haida 1 or more Vehicles in Household Correlation Chart
The statistical analysis conducted on geographies consisting of 566,661,783 people shows a moderate positive correlation between the proportion of Scottish and percentage of households with 1 or more vehicles available in the United States with a correlation coefficient (R) of 0.489 and weighted average of 93.4%. Similarly, the statistical analysis conducted on geographies consisting of 60,855,419 people shows a poor negative correlation between the proportion of Tlingit-Haida and percentage of households with 1 or more vehicles available in the United States with a correlation coefficient (R) of -0.136 and weighted average of 90.1%, a difference of 3.7%.
1 or more Vehicles in Household Correlation Summary
| Measurement | Scottish | Tlingit-Haida |
| Minimum | 69.8% | 13.7% |
| Maximum | 100.0% | 99.6% |
| Range | 30.2% | 85.9% |
| Mean | 97.1% | 83.5% |
| Median | 98.1% | 90.3% |
| Interquartile 25% (IQ1) | 95.2% | 84.6% |
| Interquartile 75% (IQ3) | 100.0% | 93.5% |
| Interquartile Range (IQR) | 4.8% | 9.0% |
| Standard Deviation (Sample) | 4.0% | 21.0% |
| Standard Deviation (Population) | 4.0% | 20.7% |
Similar Demographics by 1 or more Vehicles in Household
Demographics Similar to Scottish by 1 or more Vehicles in Household
In terms of 1 or more vehicles in household, the demographic groups most similar to Scottish are Swedish (93.3%, a difference of 0.040%), Scotch-Irish (93.3%, a difference of 0.060%), Dutch (93.3%, a difference of 0.080%), Czech (93.3%, a difference of 0.12%), and Danish (93.5%, a difference of 0.19%).
| Demographics | Rating | Rank | 1 or more Vehicles in Household |
| Luxembourgers | 100.0 /100 | #1 | Exceptional 94.8% |
| English | 100.0 /100 | #2 | Exceptional 93.8% |
| Norwegians | 100.0 /100 | #3 | Exceptional 93.7% |
| Germans | 100.0 /100 | #4 | Exceptional 93.6% |
| Yakama | 100.0 /100 | #5 | Exceptional 93.6% |
| Danes | 100.0 /100 | #6 | Exceptional 93.5% |
| Scottish | 100.0 /100 | #7 | Exceptional 93.4% |
| Swedes | 100.0 /100 | #8 | Exceptional 93.3% |
| Scotch-Irish | 100.0 /100 | #9 | Exceptional 93.3% |
| Dutch | 100.0 /100 | #10 | Exceptional 93.3% |
| Czechs | 100.0 /100 | #11 | Exceptional 93.3% |
| Scandinavians | 100.0 /100 | #12 | Exceptional 93.1% |
| Whites/Caucasians | 100.0 /100 | #13 | Exceptional 93.1% |
| Irish | 100.0 /100 | #14 | Exceptional 93.1% |
| Mexicans | 100.0 /100 | #15 | Exceptional 93.0% |
Demographics Similar to Tlingit-Haida by 1 or more Vehicles in Household
In terms of 1 or more vehicles in household, the demographic groups most similar to Tlingit-Haida are New Zealander (90.1%, a difference of 0.010%), Immigrants from Uganda (90.1%, a difference of 0.010%), Immigrants (90.1%, a difference of 0.010%), Immigrants from Bosnia and Herzegovina (90.1%, a difference of 0.020%), and Immigrants from Micronesia (90.1%, a difference of 0.030%).
| Demographics | Rating | Rank | 1 or more Vehicles in Household |
| Sioux | 81.3 /100 | #145 | Excellent 90.2% |
| Bahamians | 80.5 /100 | #146 | Excellent 90.2% |
| Chileans | 79.8 /100 | #147 | Good 90.2% |
| Immigrants | Eastern Africa | 78.2 /100 | #148 | Good 90.1% |
| Immigrants | Nicaragua | 76.7 /100 | #149 | Good 90.1% |
| Immigrants | Micronesia | 75.9 /100 | #150 | Good 90.1% |
| Immigrants | Bosnia and Herzegovina | 75.4 /100 | #151 | Good 90.1% |
| Tlingit-Haida | 74.3 /100 | #152 | Good 90.1% |
| New Zealanders | 73.8 /100 | #153 | Good 90.1% |
| Immigrants | Uganda | 73.8 /100 | #154 | Good 90.1% |
| Immigrants | Immigrants | 73.6 /100 | #155 | Good 90.1% |
| Australians | 72.4 /100 | #156 | Good 90.0% |
| Immigrants | Congo | 71.2 /100 | #157 | Good 90.0% |
| Brazilians | 71.0 /100 | #158 | Good 90.0% |
| South Africans | 69.7 /100 | #159 | Good 90.0% |