Paraguayan vs Ecuadorian 2 or more Vehicles in Household
COMPARE
Paraguayan
Ecuadorian
2 or more Vehicles in Household
2 or more Vehicles in Household Comparison
Paraguayans
Ecuadorians
50.3%
2 OR MORE VEHICLES IN HOUSEHOLD
0.0/ 100
METRIC RATING
298th/ 347
METRIC RANK
42.0%
2 OR MORE VEHICLES IN HOUSEHOLD
0.0/ 100
METRIC RATING
329th/ 347
METRIC RANK
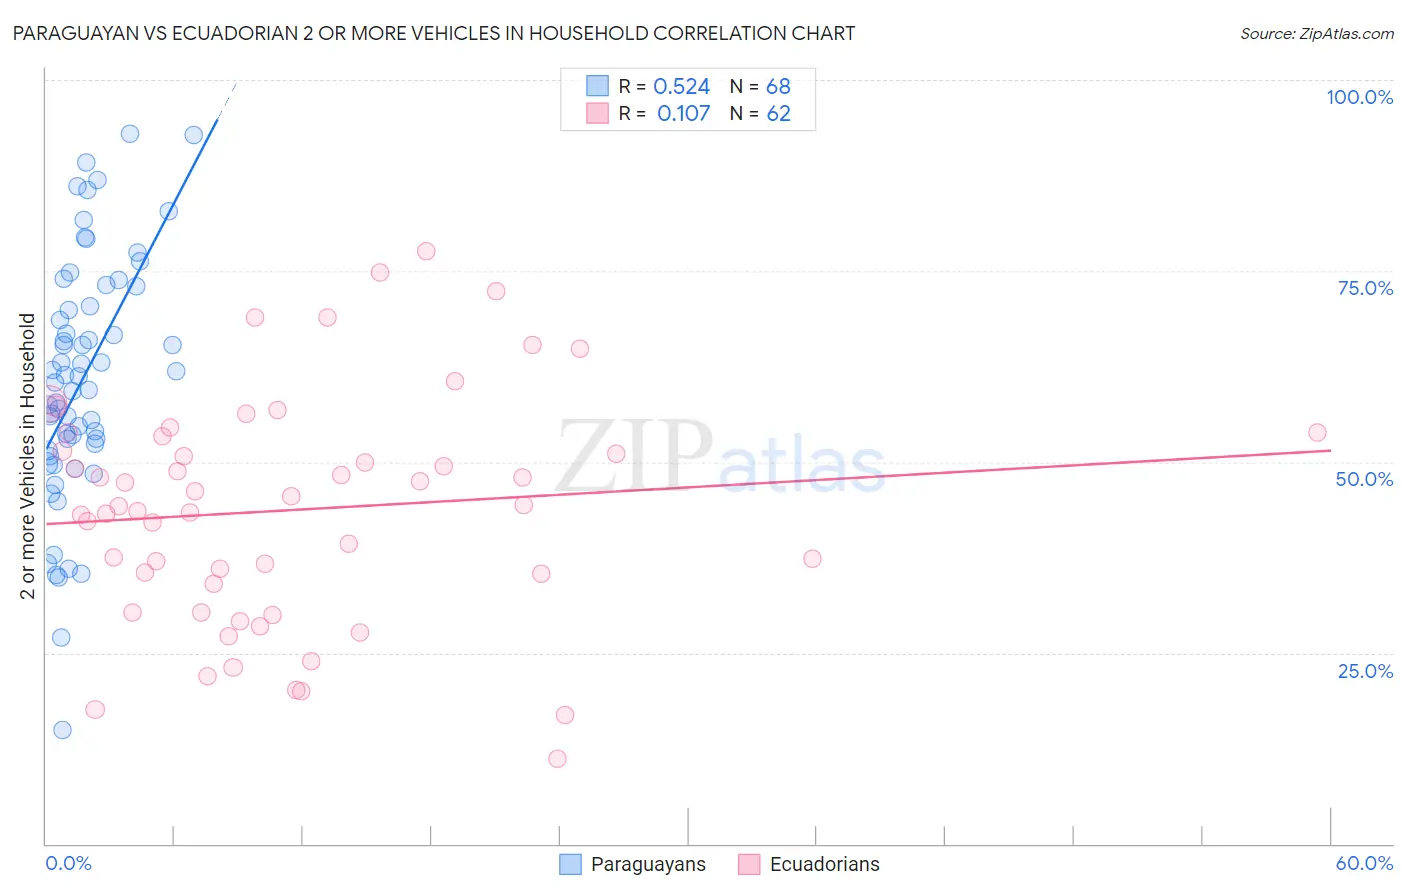
Paraguayan vs Ecuadorian 2 or more Vehicles in Household Correlation Chart
The statistical analysis conducted on geographies consisting of 95,096,913 people shows a substantial positive correlation between the proportion of Paraguayans and percentage of households with 2 or more vehicles available in the United States with a correlation coefficient (R) of 0.524 and weighted average of 50.3%. Similarly, the statistical analysis conducted on geographies consisting of 317,664,097 people shows a poor positive correlation between the proportion of Ecuadorians and percentage of households with 2 or more vehicles available in the United States with a correlation coefficient (R) of 0.107 and weighted average of 42.0%, a difference of 19.9%.
2 or more Vehicles in Household Correlation Summary
| Measurement | Paraguayan | Ecuadorian |
| Minimum | 15.0% | 11.1% |
| Maximum | 93.0% | 77.6% |
| Range | 78.0% | 66.5% |
| Mean | 60.7% | 43.7% |
| Median | 60.8% | 44.3% |
| Interquartile 25% (IQ1) | 52.0% | 34.1% |
| Interquartile 75% (IQ3) | 71.7% | 53.3% |
| Interquartile Range (IQR) | 19.7% | 19.3% |
| Standard Deviation (Sample) | 16.0% | 15.0% |
| Standard Deviation (Population) | 15.8% | 14.9% |
Similar Demographics by 2 or more Vehicles in Household
Demographics Similar to Paraguayans by 2 or more Vehicles in Household
In terms of 2 or more vehicles in household, the demographic groups most similar to Paraguayans are Immigrants from Morocco (50.3%, a difference of 0.030%), Immigrants from Russia (50.3%, a difference of 0.070%), Immigrants from Spain (50.4%, a difference of 0.13%), Immigrants from Greece (50.2%, a difference of 0.25%), and Immigrants from South America (50.2%, a difference of 0.31%).
| Demographics | Rating | Rank | 2 or more Vehicles in Household |
| Belizeans | 0.0 /100 | #291 | Tragic 51.0% |
| Immigrants | Ukraine | 0.0 /100 | #292 | Tragic 50.9% |
| Blacks/African Americans | 0.0 /100 | #293 | Tragic 50.9% |
| Bermudans | 0.0 /100 | #294 | Tragic 50.6% |
| Cypriots | 0.0 /100 | #295 | Tragic 50.6% |
| Immigrants | Somalia | 0.0 /100 | #296 | Tragic 50.5% |
| Immigrants | Spain | 0.0 /100 | #297 | Tragic 50.4% |
| Paraguayans | 0.0 /100 | #298 | Tragic 50.3% |
| Immigrants | Morocco | 0.0 /100 | #299 | Tragic 50.3% |
| Immigrants | Russia | 0.0 /100 | #300 | Tragic 50.3% |
| Immigrants | Greece | 0.0 /100 | #301 | Tragic 50.2% |
| Immigrants | South America | 0.0 /100 | #302 | Tragic 50.2% |
| Tohono O'odham | 0.0 /100 | #303 | Tragic 50.0% |
| Immigrants | Belize | 0.0 /100 | #304 | Tragic 49.9% |
| Immigrants | Western Africa | 0.0 /100 | #305 | Tragic 49.4% |
Demographics Similar to Ecuadorians by 2 or more Vehicles in Household
In terms of 2 or more vehicles in household, the demographic groups most similar to Ecuadorians are Immigrants from Dominica (41.6%, a difference of 0.82%), Inupiat (42.6%, a difference of 1.6%), West Indian (41.3%, a difference of 1.7%), Immigrants from Yemen (42.8%, a difference of 2.1%), and Immigrants from Senegal (43.0%, a difference of 2.5%).
| Demographics | Rating | Rank | 2 or more Vehicles in Household |
| Senegalese | 0.0 /100 | #322 | Tragic 44.2% |
| Immigrants | Caribbean | 0.0 /100 | #323 | Tragic 44.2% |
| Immigrants | Cabo Verde | 0.0 /100 | #324 | Tragic 43.3% |
| Immigrants | West Indies | 0.0 /100 | #325 | Tragic 43.1% |
| Immigrants | Senegal | 0.0 /100 | #326 | Tragic 43.0% |
| Immigrants | Yemen | 0.0 /100 | #327 | Tragic 42.8% |
| Inupiat | 0.0 /100 | #328 | Tragic 42.6% |
| Ecuadorians | 0.0 /100 | #329 | Tragic 42.0% |
| Immigrants | Dominica | 0.0 /100 | #330 | Tragic 41.6% |
| West Indians | 0.0 /100 | #331 | Tragic 41.3% |
| Trinidadians and Tobagonians | 0.0 /100 | #332 | Tragic 40.9% |
| Immigrants | Ecuador | 0.0 /100 | #333 | Tragic 40.5% |
| Immigrants | Trinidad and Tobago | 0.0 /100 | #334 | Tragic 40.3% |
| Immigrants | Bangladesh | 0.0 /100 | #335 | Tragic 38.8% |
| Vietnamese | 0.0 /100 | #336 | Tragic 38.5% |