Potawatomi vs Tsimshian 2 or more Vehicles in Household
COMPARE
Potawatomi
Tsimshian
2 or more Vehicles in Household
2 or more Vehicles in Household Comparison
Potawatomi
Tsimshian
58.0%
2 OR MORE VEHICLES IN HOUSEHOLD
99.1/ 100
METRIC RATING
86th/ 347
METRIC RANK
56.7%
2 OR MORE VEHICLES IN HOUSEHOLD
91.6/ 100
METRIC RATING
125th/ 347
METRIC RANK
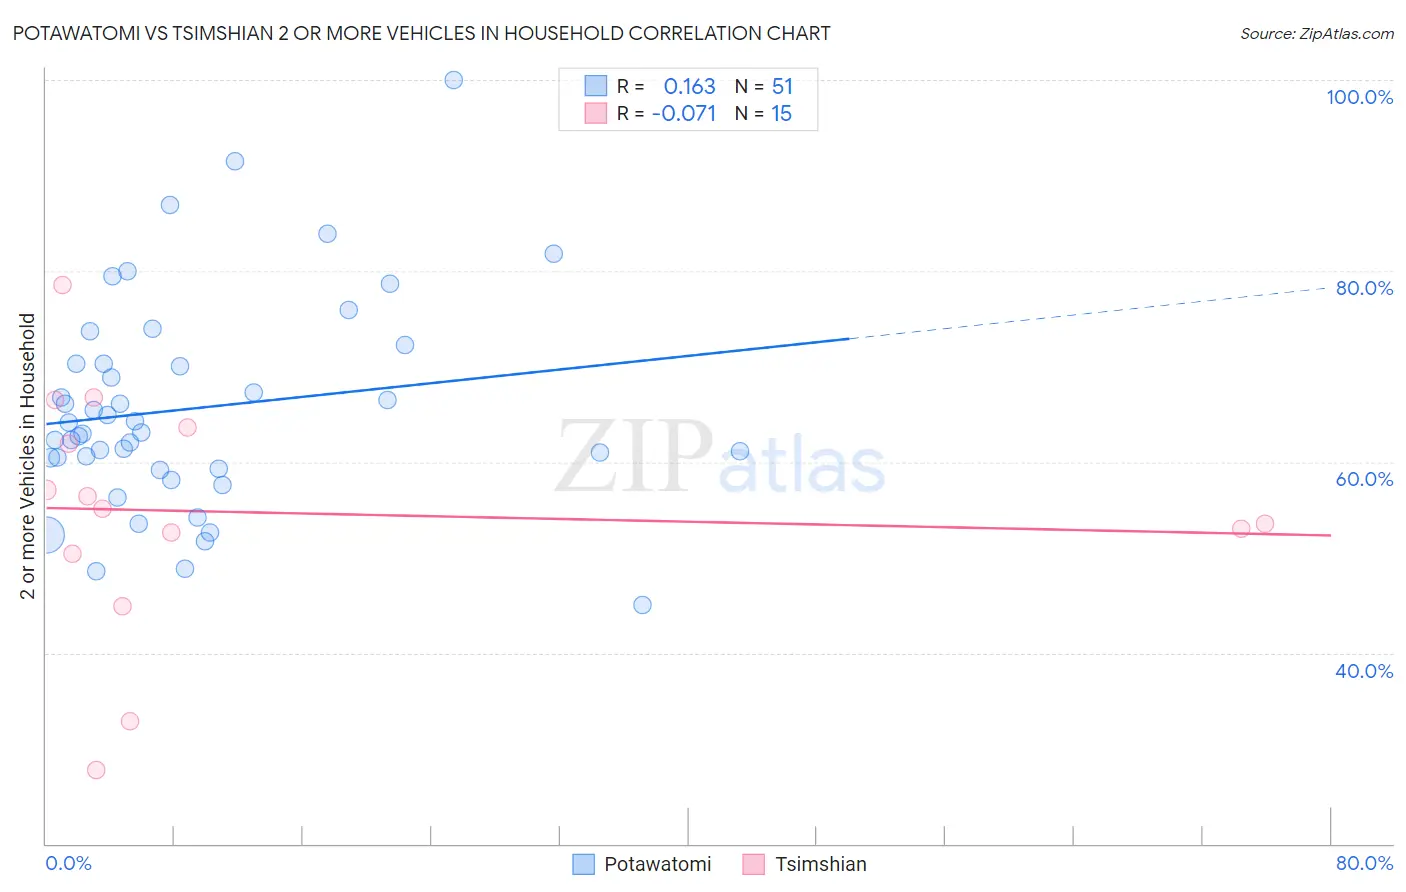
Potawatomi vs Tsimshian 2 or more Vehicles in Household Correlation Chart
The statistical analysis conducted on geographies consisting of 117,759,902 people shows a poor positive correlation between the proportion of Potawatomi and percentage of households with 2 or more vehicles available in the United States with a correlation coefficient (R) of 0.163 and weighted average of 58.0%. Similarly, the statistical analysis conducted on geographies consisting of 15,626,544 people shows a slight negative correlation between the proportion of Tsimshian and percentage of households with 2 or more vehicles available in the United States with a correlation coefficient (R) of -0.071 and weighted average of 56.7%, a difference of 2.3%.
2 or more Vehicles in Household Correlation Summary
| Measurement | Potawatomi | Tsimshian |
| Minimum | 45.0% | 27.8% |
| Maximum | 100.0% | 78.5% |
| Range | 55.0% | 50.8% |
| Mean | 65.6% | 54.7% |
| Median | 63.1% | 55.1% |
| Interquartile 25% (IQ1) | 59.2% | 50.3% |
| Interquartile 75% (IQ3) | 70.3% | 63.6% |
| Interquartile Range (IQR) | 11.1% | 13.3% |
| Standard Deviation (Sample) | 11.1% | 12.9% |
| Standard Deviation (Population) | 11.0% | 12.4% |
Similar Demographics by 2 or more Vehicles in Household
Demographics Similar to Potawatomi by 2 or more Vehicles in Household
In terms of 2 or more vehicles in household, the demographic groups most similar to Potawatomi are Slovak (58.0%, a difference of 0.030%), Thai (57.9%, a difference of 0.040%), Immigrants from Iran (57.9%, a difference of 0.050%), Maltese (58.0%, a difference of 0.080%), and Icelander (58.0%, a difference of 0.11%).
| Demographics | Rating | Rank | 2 or more Vehicles in Household |
| Delaware | 99.4 /100 | #79 | Exceptional 58.2% |
| Immigrants | England | 99.3 /100 | #80 | Exceptional 58.1% |
| Immigrants | Iraq | 99.3 /100 | #81 | Exceptional 58.1% |
| Iranians | 99.3 /100 | #82 | Exceptional 58.1% |
| Icelanders | 99.2 /100 | #83 | Exceptional 58.0% |
| Maltese | 99.2 /100 | #84 | Exceptional 58.0% |
| Slovaks | 99.2 /100 | #85 | Exceptional 58.0% |
| Potawatomi | 99.1 /100 | #86 | Exceptional 58.0% |
| Thais | 99.1 /100 | #87 | Exceptional 57.9% |
| Immigrants | Iran | 99.1 /100 | #88 | Exceptional 57.9% |
| Immigrants | Germany | 99.0 /100 | #89 | Exceptional 57.9% |
| Hispanics or Latinos | 99.0 /100 | #90 | Exceptional 57.9% |
| Pakistanis | 99.0 /100 | #91 | Exceptional 57.9% |
| Shoshone | 99.0 /100 | #92 | Exceptional 57.9% |
| Ottawa | 99.0 /100 | #93 | Exceptional 57.9% |
Demographics Similar to Tsimshian by 2 or more Vehicles in Household
In terms of 2 or more vehicles in household, the demographic groups most similar to Tsimshian are New Zealander (56.7%, a difference of 0.020%), Australian (56.7%, a difference of 0.030%), Estonian (56.6%, a difference of 0.080%), Immigrants from Thailand (56.6%, a difference of 0.11%), and Immigrants from South Africa (56.7%, a difference of 0.12%).
| Demographics | Rating | Rank | 2 or more Vehicles in Household |
| Asians | 95.1 /100 | #118 | Exceptional 57.0% |
| Natives/Alaskans | 95.0 /100 | #119 | Exceptional 57.0% |
| Costa Ricans | 94.7 /100 | #120 | Exceptional 56.9% |
| Sioux | 93.8 /100 | #121 | Exceptional 56.8% |
| Immigrants | South Africa | 92.5 /100 | #122 | Exceptional 56.7% |
| Australians | 91.8 /100 | #123 | Exceptional 56.7% |
| New Zealanders | 91.8 /100 | #124 | Exceptional 56.7% |
| Tsimshian | 91.6 /100 | #125 | Exceptional 56.7% |
| Estonians | 90.9 /100 | #126 | Exceptional 56.6% |
| Immigrants | Thailand | 90.7 /100 | #127 | Exceptional 56.6% |
| Immigrants | South Central Asia | 90.5 /100 | #128 | Exceptional 56.6% |
| Ute | 90.4 /100 | #129 | Exceptional 56.6% |
| Yugoslavians | 90.0 /100 | #130 | Exceptional 56.6% |
| Bulgarians | 89.7 /100 | #131 | Excellent 56.5% |
| Hungarians | 89.1 /100 | #132 | Excellent 56.5% |