Paraguayan vs Czechoslovakian 2 or more Vehicles in Household
COMPARE
Paraguayan
Czechoslovakian
2 or more Vehicles in Household
2 or more Vehicles in Household Comparison
Paraguayans
Czechoslovakians
50.3%
2 OR MORE VEHICLES IN HOUSEHOLD
0.0/ 100
METRIC RATING
298th/ 347
METRIC RANK
59.8%
2 OR MORE VEHICLES IN HOUSEHOLD
100.0/ 100
METRIC RATING
43rd/ 347
METRIC RANK
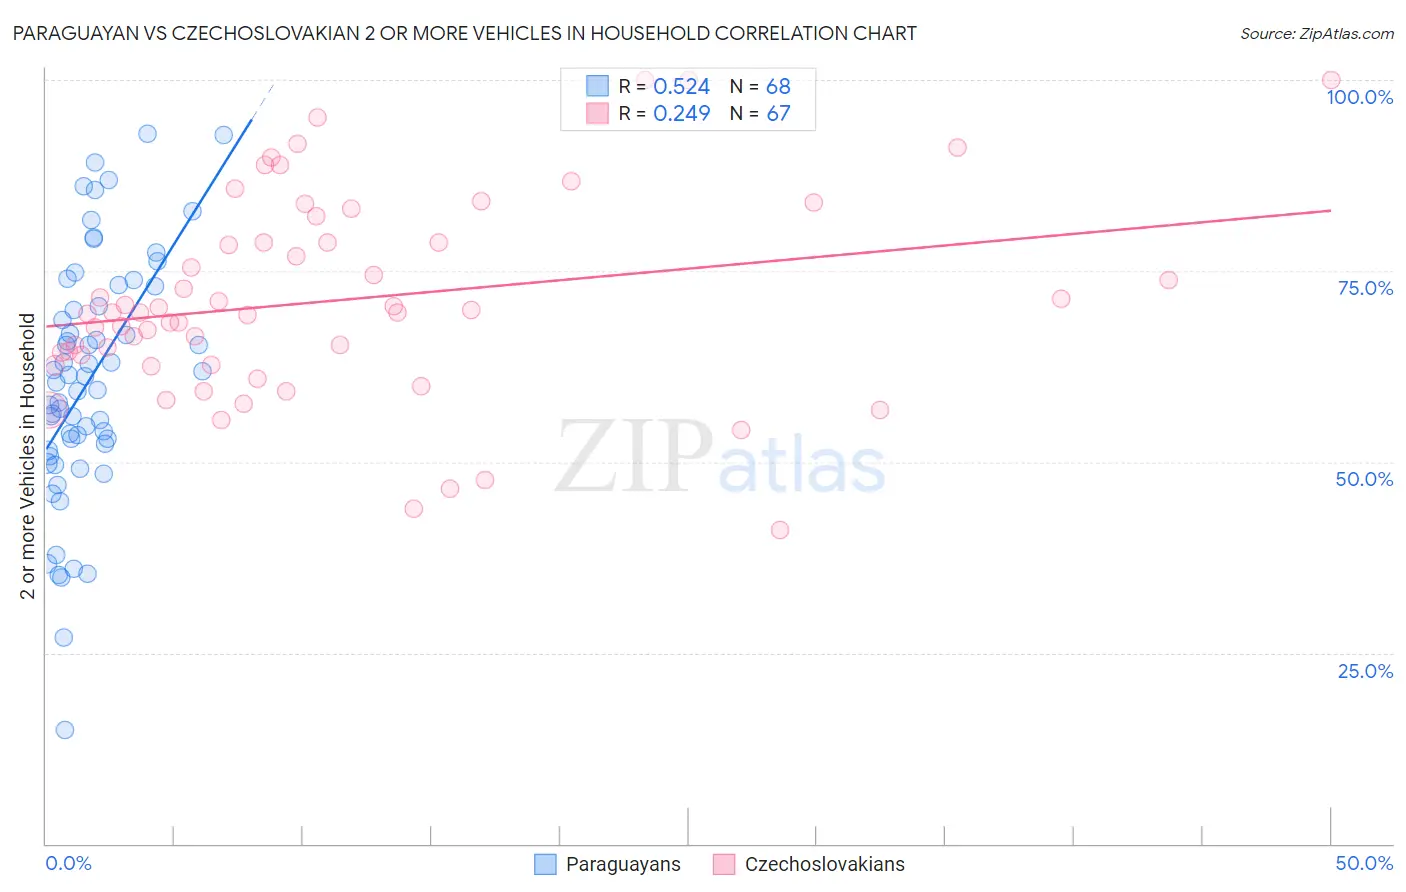
Paraguayan vs Czechoslovakian 2 or more Vehicles in Household Correlation Chart
The statistical analysis conducted on geographies consisting of 95,096,913 people shows a substantial positive correlation between the proportion of Paraguayans and percentage of households with 2 or more vehicles available in the United States with a correlation coefficient (R) of 0.524 and weighted average of 50.3%. Similarly, the statistical analysis conducted on geographies consisting of 368,548,443 people shows a weak positive correlation between the proportion of Czechoslovakians and percentage of households with 2 or more vehicles available in the United States with a correlation coefficient (R) of 0.249 and weighted average of 59.8%, a difference of 18.8%.
2 or more Vehicles in Household Correlation Summary
| Measurement | Paraguayan | Czechoslovakian |
| Minimum | 15.0% | 41.1% |
| Maximum | 93.0% | 100.0% |
| Range | 78.0% | 58.9% |
| Mean | 60.7% | 71.2% |
| Median | 60.8% | 69.5% |
| Interquartile 25% (IQ1) | 52.0% | 62.6% |
| Interquartile 75% (IQ3) | 71.7% | 78.8% |
| Interquartile Range (IQR) | 19.7% | 16.2% |
| Standard Deviation (Sample) | 16.0% | 13.2% |
| Standard Deviation (Population) | 15.8% | 13.1% |
Similar Demographics by 2 or more Vehicles in Household
Demographics Similar to Paraguayans by 2 or more Vehicles in Household
In terms of 2 or more vehicles in household, the demographic groups most similar to Paraguayans are Immigrants from Morocco (50.3%, a difference of 0.030%), Immigrants from Russia (50.3%, a difference of 0.070%), Immigrants from Spain (50.4%, a difference of 0.13%), Immigrants from Greece (50.2%, a difference of 0.25%), and Immigrants from South America (50.2%, a difference of 0.31%).
| Demographics | Rating | Rank | 2 or more Vehicles in Household |
| Belizeans | 0.0 /100 | #291 | Tragic 51.0% |
| Immigrants | Ukraine | 0.0 /100 | #292 | Tragic 50.9% |
| Blacks/African Americans | 0.0 /100 | #293 | Tragic 50.9% |
| Bermudans | 0.0 /100 | #294 | Tragic 50.6% |
| Cypriots | 0.0 /100 | #295 | Tragic 50.6% |
| Immigrants | Somalia | 0.0 /100 | #296 | Tragic 50.5% |
| Immigrants | Spain | 0.0 /100 | #297 | Tragic 50.4% |
| Paraguayans | 0.0 /100 | #298 | Tragic 50.3% |
| Immigrants | Morocco | 0.0 /100 | #299 | Tragic 50.3% |
| Immigrants | Russia | 0.0 /100 | #300 | Tragic 50.3% |
| Immigrants | Greece | 0.0 /100 | #301 | Tragic 50.2% |
| Immigrants | South America | 0.0 /100 | #302 | Tragic 50.2% |
| Tohono O'odham | 0.0 /100 | #303 | Tragic 50.0% |
| Immigrants | Belize | 0.0 /100 | #304 | Tragic 49.9% |
| Immigrants | Western Africa | 0.0 /100 | #305 | Tragic 49.4% |
Demographics Similar to Czechoslovakians by 2 or more Vehicles in Household
In terms of 2 or more vehicles in household, the demographic groups most similar to Czechoslovakians are French (59.8%, a difference of 0.060%), Malaysian (59.8%, a difference of 0.080%), Northern European (59.9%, a difference of 0.090%), Immigrants from Taiwan (59.7%, a difference of 0.10%), and Cherokee (59.9%, a difference of 0.11%).
| Demographics | Rating | Rank | 2 or more Vehicles in Household |
| Chinese | 100.0 /100 | #36 | Exceptional 60.1% |
| Irish | 100.0 /100 | #37 | Exceptional 60.1% |
| Americans | 100.0 /100 | #38 | Exceptional 60.0% |
| British | 100.0 /100 | #39 | Exceptional 60.0% |
| Cherokee | 100.0 /100 | #40 | Exceptional 59.9% |
| Northern Europeans | 100.0 /100 | #41 | Exceptional 59.9% |
| Malaysians | 100.0 /100 | #42 | Exceptional 59.8% |
| Czechoslovakians | 100.0 /100 | #43 | Exceptional 59.8% |
| French | 100.0 /100 | #44 | Exceptional 59.8% |
| Immigrants | Taiwan | 100.0 /100 | #45 | Exceptional 59.7% |
| Immigrants | South Eastern Asia | 100.0 /100 | #46 | Exceptional 59.6% |
| Yaqui | 99.9 /100 | #47 | Exceptional 59.3% |
| Immigrants | India | 99.9 /100 | #48 | Exceptional 59.3% |
| Belgians | 99.9 /100 | #49 | Exceptional 59.3% |
| Choctaw | 99.9 /100 | #50 | Exceptional 59.3% |