Spanish vs Tsimshian 2 or more Vehicles in Household
COMPARE
Spanish
Tsimshian
2 or more Vehicles in Household
2 or more Vehicles in Household Comparison
Spanish
Tsimshian
60.2%
2 OR MORE VEHICLES IN HOUSEHOLD
100.0/ 100
METRIC RATING
34th/ 347
METRIC RANK
56.7%
2 OR MORE VEHICLES IN HOUSEHOLD
91.6/ 100
METRIC RATING
125th/ 347
METRIC RANK
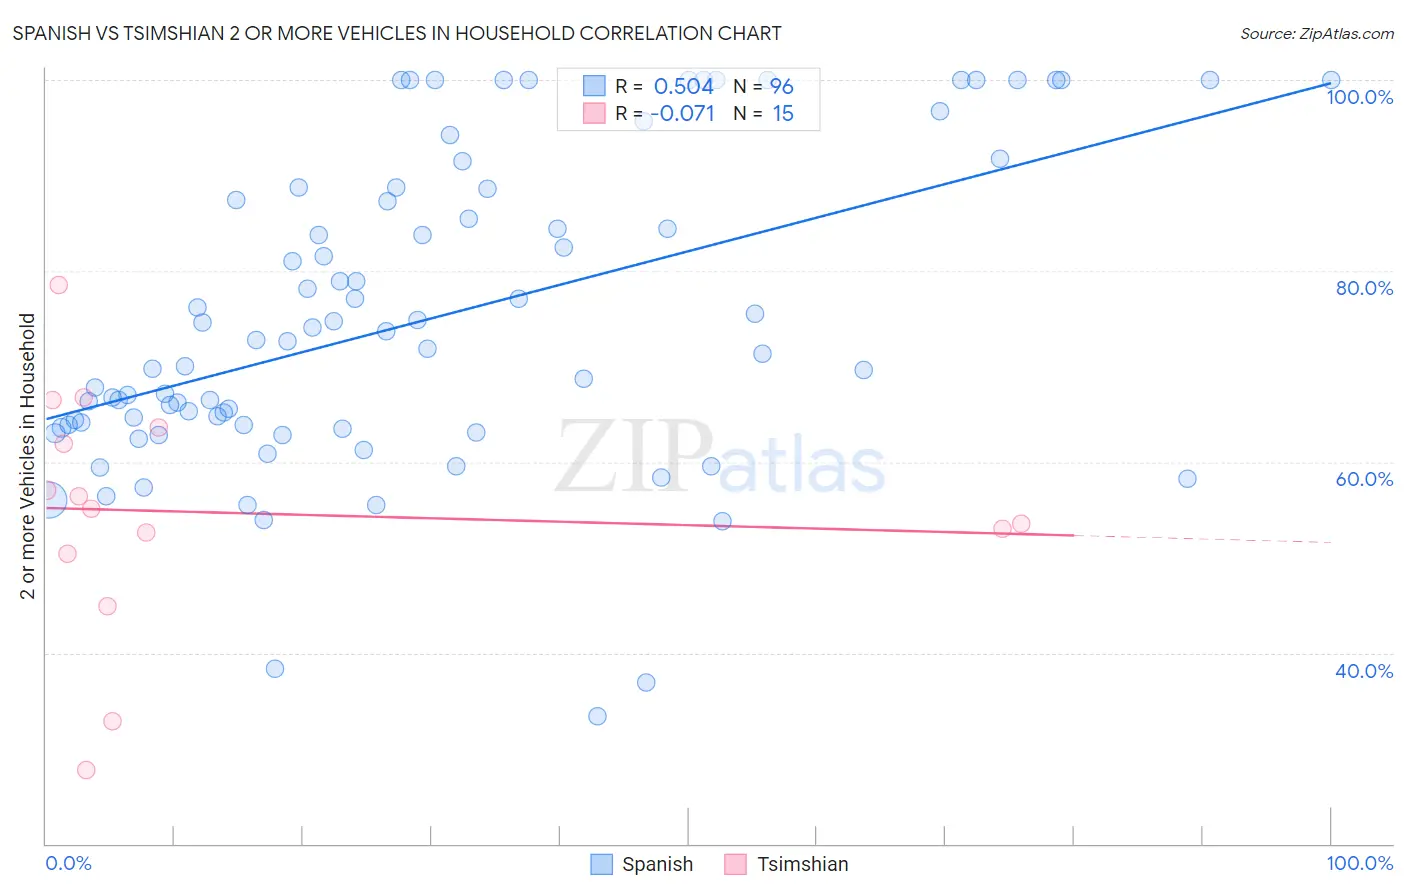
Spanish vs Tsimshian 2 or more Vehicles in Household Correlation Chart
The statistical analysis conducted on geographies consisting of 421,956,041 people shows a substantial positive correlation between the proportion of Spanish and percentage of households with 2 or more vehicles available in the United States with a correlation coefficient (R) of 0.504 and weighted average of 60.2%. Similarly, the statistical analysis conducted on geographies consisting of 15,626,544 people shows a slight negative correlation between the proportion of Tsimshian and percentage of households with 2 or more vehicles available in the United States with a correlation coefficient (R) of -0.071 and weighted average of 56.7%, a difference of 6.2%.
2 or more Vehicles in Household Correlation Summary
| Measurement | Spanish | Tsimshian |
| Minimum | 33.3% | 27.8% |
| Maximum | 100.0% | 78.5% |
| Range | 66.7% | 50.8% |
| Mean | 74.9% | 54.7% |
| Median | 72.2% | 55.1% |
| Interquartile 25% (IQ1) | 63.7% | 50.3% |
| Interquartile 75% (IQ3) | 88.0% | 63.6% |
| Interquartile Range (IQR) | 24.3% | 13.3% |
| Standard Deviation (Sample) | 16.2% | 12.9% |
| Standard Deviation (Population) | 16.1% | 12.4% |
Similar Demographics by 2 or more Vehicles in Household
Demographics Similar to Spanish by 2 or more Vehicles in Household
In terms of 2 or more vehicles in household, the demographic groups most similar to Spanish are Immigrants from Mexico (60.2%, a difference of 0.050%), Arapaho (60.2%, a difference of 0.11%), Immigrants from Philippines (60.1%, a difference of 0.12%), Chinese (60.1%, a difference of 0.14%), and Irish (60.1%, a difference of 0.18%).
| Demographics | Rating | Rank | 2 or more Vehicles in Household |
| Assyrians/Chaldeans/Syriacs | 100.0 /100 | #27 | Exceptional 60.5% |
| Guamanians/Chamorros | 100.0 /100 | #28 | Exceptional 60.5% |
| Hawaiians | 100.0 /100 | #29 | Exceptional 60.4% |
| Finns | 100.0 /100 | #30 | Exceptional 60.3% |
| Spanish American Indians | 100.0 /100 | #31 | Exceptional 60.3% |
| Arapaho | 100.0 /100 | #32 | Exceptional 60.2% |
| Immigrants | Mexico | 100.0 /100 | #33 | Exceptional 60.2% |
| Spanish | 100.0 /100 | #34 | Exceptional 60.2% |
| Immigrants | Philippines | 100.0 /100 | #35 | Exceptional 60.1% |
| Chinese | 100.0 /100 | #36 | Exceptional 60.1% |
| Irish | 100.0 /100 | #37 | Exceptional 60.1% |
| Americans | 100.0 /100 | #38 | Exceptional 60.0% |
| British | 100.0 /100 | #39 | Exceptional 60.0% |
| Cherokee | 100.0 /100 | #40 | Exceptional 59.9% |
| Northern Europeans | 100.0 /100 | #41 | Exceptional 59.9% |
Demographics Similar to Tsimshian by 2 or more Vehicles in Household
In terms of 2 or more vehicles in household, the demographic groups most similar to Tsimshian are New Zealander (56.7%, a difference of 0.020%), Australian (56.7%, a difference of 0.030%), Estonian (56.6%, a difference of 0.080%), Immigrants from Thailand (56.6%, a difference of 0.11%), and Immigrants from South Africa (56.7%, a difference of 0.12%).
| Demographics | Rating | Rank | 2 or more Vehicles in Household |
| Asians | 95.1 /100 | #118 | Exceptional 57.0% |
| Natives/Alaskans | 95.0 /100 | #119 | Exceptional 57.0% |
| Costa Ricans | 94.7 /100 | #120 | Exceptional 56.9% |
| Sioux | 93.8 /100 | #121 | Exceptional 56.8% |
| Immigrants | South Africa | 92.5 /100 | #122 | Exceptional 56.7% |
| Australians | 91.8 /100 | #123 | Exceptional 56.7% |
| New Zealanders | 91.8 /100 | #124 | Exceptional 56.7% |
| Tsimshian | 91.6 /100 | #125 | Exceptional 56.7% |
| Estonians | 90.9 /100 | #126 | Exceptional 56.6% |
| Immigrants | Thailand | 90.7 /100 | #127 | Exceptional 56.6% |
| Immigrants | South Central Asia | 90.5 /100 | #128 | Exceptional 56.6% |
| Ute | 90.4 /100 | #129 | Exceptional 56.6% |
| Yugoslavians | 90.0 /100 | #130 | Exceptional 56.6% |
| Bulgarians | 89.7 /100 | #131 | Excellent 56.5% |
| Hungarians | 89.1 /100 | #132 | Excellent 56.5% |