New Zealander vs Greek 2 or more Vehicles in Household
COMPARE
New Zealander
Greek
2 or more Vehicles in Household
2 or more Vehicles in Household Comparison
New Zealanders
Greeks
56.7%
2 OR MORE VEHICLES IN HOUSEHOLD
91.8/ 100
METRIC RATING
124th/ 347
METRIC RANK
57.5%
2 OR MORE VEHICLES IN HOUSEHOLD
98.0/ 100
METRIC RATING
111th/ 347
METRIC RANK
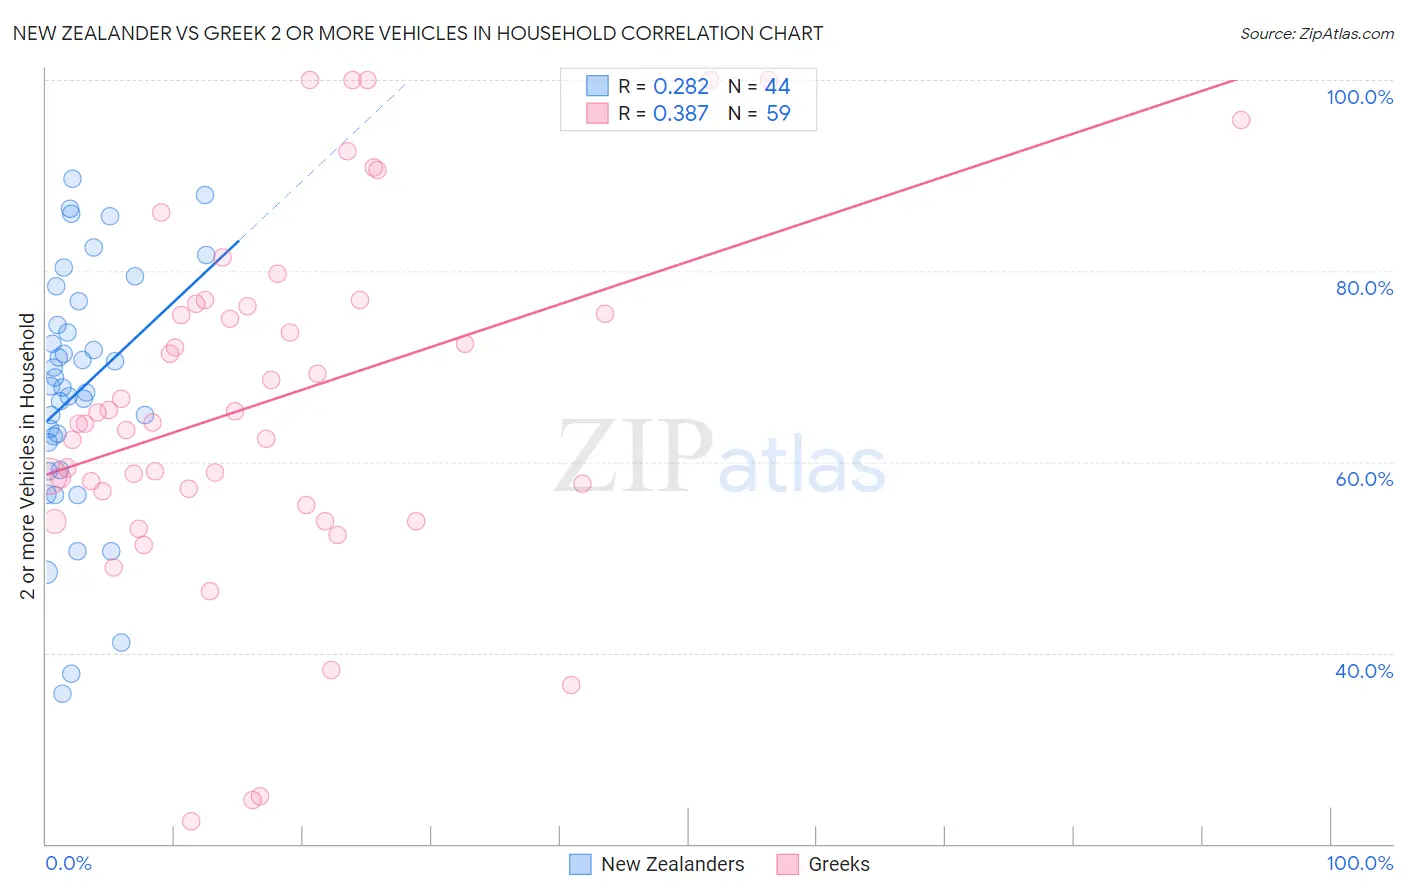
New Zealander vs Greek 2 or more Vehicles in Household Correlation Chart
The statistical analysis conducted on geographies consisting of 106,900,392 people shows a weak positive correlation between the proportion of New Zealanders and percentage of households with 2 or more vehicles available in the United States with a correlation coefficient (R) of 0.282 and weighted average of 56.7%. Similarly, the statistical analysis conducted on geographies consisting of 482,397,984 people shows a mild positive correlation between the proportion of Greeks and percentage of households with 2 or more vehicles available in the United States with a correlation coefficient (R) of 0.387 and weighted average of 57.5%, a difference of 1.4%.
2 or more Vehicles in Household Correlation Summary
| Measurement | New Zealander | Greek |
| Minimum | 35.8% | 22.4% |
| Maximum | 89.7% | 100.0% |
| Range | 53.9% | 77.6% |
| Mean | 67.4% | 66.4% |
| Median | 67.9% | 64.1% |
| Interquartile 25% (IQ1) | 60.6% | 56.9% |
| Interquartile 75% (IQ3) | 75.6% | 76.6% |
| Interquartile Range (IQR) | 15.0% | 19.7% |
| Standard Deviation (Sample) | 12.9% | 18.4% |
| Standard Deviation (Population) | 12.8% | 18.3% |
Demographics Similar to New Zealanders and Greeks by 2 or more Vehicles in Household
In terms of 2 or more vehicles in household, the demographic groups most similar to New Zealanders are Australian (56.7%, a difference of 0.0%), Tsimshian (56.7%, a difference of 0.020%), Immigrants from South Africa (56.7%, a difference of 0.10%), Estonian (56.6%, a difference of 0.10%), and Immigrants from Thailand (56.6%, a difference of 0.13%). Similarly, the demographic groups most similar to Greeks are Pueblo (57.5%, a difference of 0.0%), Japanese (57.5%, a difference of 0.030%), Immigrants from North America (57.5%, a difference of 0.050%), Immigrants from Canada (57.5%, a difference of 0.080%), and Immigrants from Netherlands (57.5%, a difference of 0.10%).
| Demographics | Rating | Rank | 2 or more Vehicles in Household |
| Immigrants | Netherlands | 98.2 /100 | #107 | Exceptional 57.5% |
| Immigrants | Canada | 98.1 /100 | #108 | Exceptional 57.5% |
| Immigrants | North America | 98.1 /100 | #109 | Exceptional 57.5% |
| Japanese | 98.0 /100 | #110 | Exceptional 57.5% |
| Greeks | 98.0 /100 | #111 | Exceptional 57.5% |
| Pueblo | 98.0 /100 | #112 | Exceptional 57.5% |
| Zimbabweans | 96.9 /100 | #113 | Exceptional 57.2% |
| Immigrants | Lebanon | 96.8 /100 | #114 | Exceptional 57.2% |
| Chippewa | 96.6 /100 | #115 | Exceptional 57.2% |
| Immigrants | Jordan | 96.6 /100 | #116 | Exceptional 57.2% |
| Iraqis | 95.8 /100 | #117 | Exceptional 57.1% |
| Asians | 95.1 /100 | #118 | Exceptional 57.0% |
| Natives/Alaskans | 95.0 /100 | #119 | Exceptional 57.0% |
| Costa Ricans | 94.7 /100 | #120 | Exceptional 56.9% |
| Sioux | 93.8 /100 | #121 | Exceptional 56.8% |
| Immigrants | South Africa | 92.5 /100 | #122 | Exceptional 56.7% |
| Australians | 91.8 /100 | #123 | Exceptional 56.7% |
| New Zealanders | 91.8 /100 | #124 | Exceptional 56.7% |
| Tsimshian | 91.6 /100 | #125 | Exceptional 56.7% |
| Estonians | 90.9 /100 | #126 | Exceptional 56.6% |
| Immigrants | Thailand | 90.7 /100 | #127 | Exceptional 56.6% |