New Zealander vs Cambodian 2 or more Vehicles in Household
COMPARE
New Zealander
Cambodian
2 or more Vehicles in Household
2 or more Vehicles in Household Comparison
New Zealanders
Cambodians
56.7%
2 OR MORE VEHICLES IN HOUSEHOLD
91.8/ 100
METRIC RATING
124th/ 347
METRIC RANK
53.3%
2 OR MORE VEHICLES IN HOUSEHOLD
2.3/ 100
METRIC RATING
239th/ 347
METRIC RANK
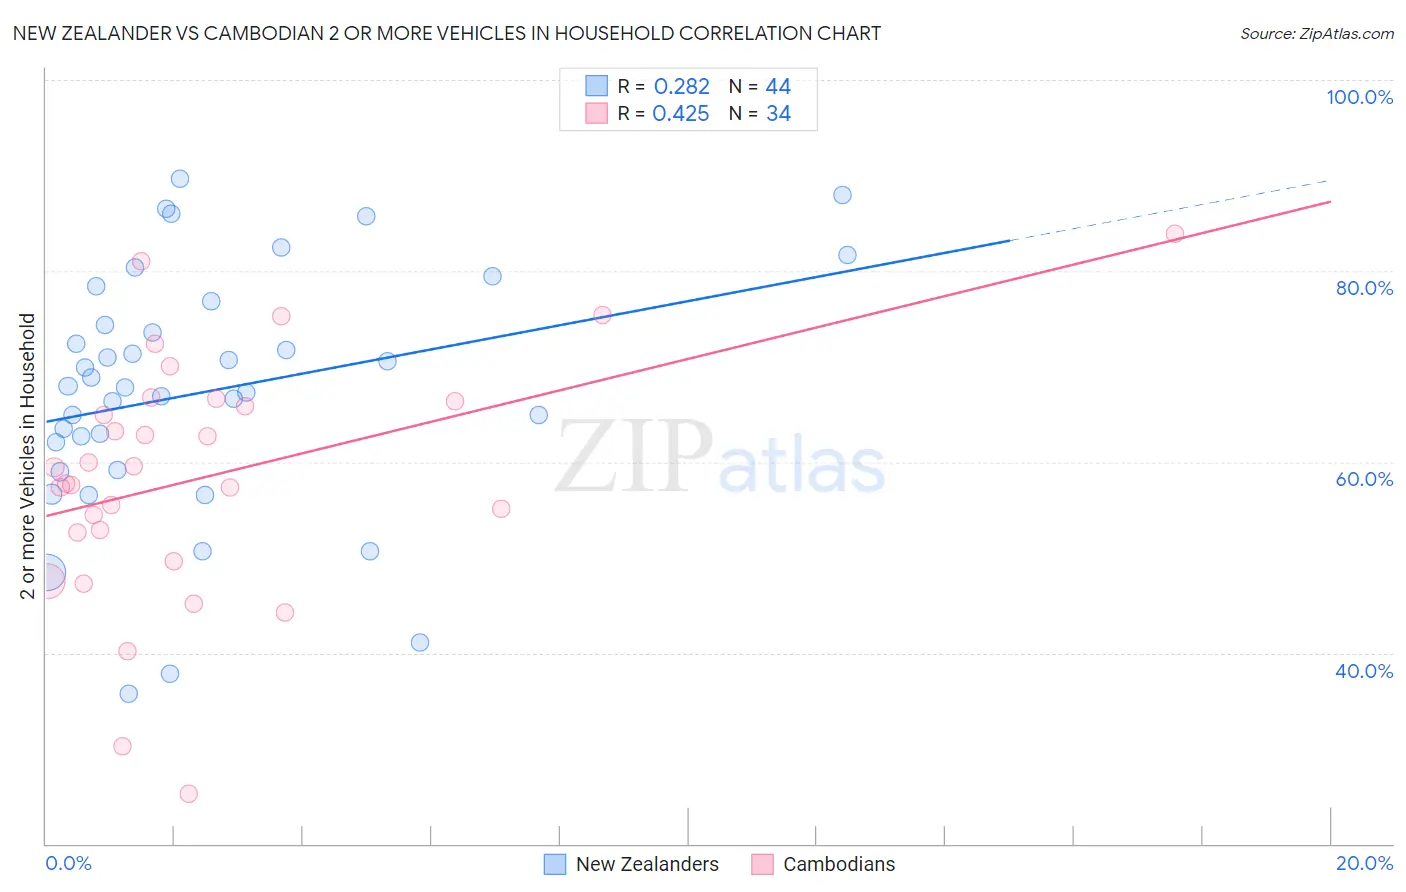
New Zealander vs Cambodian 2 or more Vehicles in Household Correlation Chart
The statistical analysis conducted on geographies consisting of 106,900,392 people shows a weak positive correlation between the proportion of New Zealanders and percentage of households with 2 or more vehicles available in the United States with a correlation coefficient (R) of 0.282 and weighted average of 56.7%. Similarly, the statistical analysis conducted on geographies consisting of 102,491,174 people shows a moderate positive correlation between the proportion of Cambodians and percentage of households with 2 or more vehicles available in the United States with a correlation coefficient (R) of 0.425 and weighted average of 53.3%, a difference of 6.4%.
2 or more Vehicles in Household Correlation Summary
| Measurement | New Zealander | Cambodian |
| Minimum | 35.8% | 25.3% |
| Maximum | 89.7% | 83.9% |
| Range | 53.9% | 58.6% |
| Mean | 67.4% | 58.4% |
| Median | 67.9% | 58.6% |
| Interquartile 25% (IQ1) | 60.6% | 52.7% |
| Interquartile 75% (IQ3) | 75.6% | 66.4% |
| Interquartile Range (IQR) | 15.0% | 13.8% |
| Standard Deviation (Sample) | 12.9% | 12.9% |
| Standard Deviation (Population) | 12.8% | 12.7% |
Similar Demographics by 2 or more Vehicles in Household
Demographics Similar to New Zealanders by 2 or more Vehicles in Household
In terms of 2 or more vehicles in household, the demographic groups most similar to New Zealanders are Australian (56.7%, a difference of 0.0%), Tsimshian (56.7%, a difference of 0.020%), Immigrants from South Africa (56.7%, a difference of 0.10%), Estonian (56.6%, a difference of 0.10%), and Immigrants from Thailand (56.6%, a difference of 0.13%).
| Demographics | Rating | Rank | 2 or more Vehicles in Household |
| Iraqis | 95.8 /100 | #117 | Exceptional 57.1% |
| Asians | 95.1 /100 | #118 | Exceptional 57.0% |
| Natives/Alaskans | 95.0 /100 | #119 | Exceptional 57.0% |
| Costa Ricans | 94.7 /100 | #120 | Exceptional 56.9% |
| Sioux | 93.8 /100 | #121 | Exceptional 56.8% |
| Immigrants | South Africa | 92.5 /100 | #122 | Exceptional 56.7% |
| Australians | 91.8 /100 | #123 | Exceptional 56.7% |
| New Zealanders | 91.8 /100 | #124 | Exceptional 56.7% |
| Tsimshian | 91.6 /100 | #125 | Exceptional 56.7% |
| Estonians | 90.9 /100 | #126 | Exceptional 56.6% |
| Immigrants | Thailand | 90.7 /100 | #127 | Exceptional 56.6% |
| Immigrants | South Central Asia | 90.5 /100 | #128 | Exceptional 56.6% |
| Ute | 90.4 /100 | #129 | Exceptional 56.6% |
| Yugoslavians | 90.0 /100 | #130 | Exceptional 56.6% |
| Bulgarians | 89.7 /100 | #131 | Excellent 56.5% |
Demographics Similar to Cambodians by 2 or more Vehicles in Household
In terms of 2 or more vehicles in household, the demographic groups most similar to Cambodians are Immigrants from Armenia (53.3%, a difference of 0.010%), Macedonian (53.3%, a difference of 0.070%), Immigrants from Europe (53.2%, a difference of 0.070%), Immigrants from Sierra Leone (53.2%, a difference of 0.10%), and Immigrants from Eastern Asia (53.2%, a difference of 0.10%).
| Demographics | Rating | Rank | 2 or more Vehicles in Household |
| Immigrants | Guatemala | 3.2 /100 | #232 | Tragic 53.5% |
| Ugandans | 3.2 /100 | #233 | Tragic 53.5% |
| Immigrants | Switzerland | 3.0 /100 | #234 | Tragic 53.4% |
| Immigrants | Middle Africa | 3.0 /100 | #235 | Tragic 53.4% |
| Indonesians | 2.7 /100 | #236 | Tragic 53.4% |
| Macedonians | 2.4 /100 | #237 | Tragic 53.3% |
| Immigrants | Armenia | 2.3 /100 | #238 | Tragic 53.3% |
| Cambodians | 2.3 /100 | #239 | Tragic 53.3% |
| Immigrants | Europe | 2.1 /100 | #240 | Tragic 53.2% |
| Immigrants | Sierra Leone | 2.1 /100 | #241 | Tragic 53.2% |
| Immigrants | Eastern Asia | 2.1 /100 | #242 | Tragic 53.2% |
| Ethiopians | 1.7 /100 | #243 | Tragic 53.1% |
| Indians (Asian) | 1.7 /100 | #244 | Tragic 53.1% |
| Immigrants | Ethiopia | 1.5 /100 | #245 | Tragic 53.0% |
| Immigrants | Nigeria | 1.2 /100 | #246 | Tragic 52.9% |