Tongan vs Greek 2 or more Vehicles in Household
COMPARE
Tongan
Greek
2 or more Vehicles in Household
2 or more Vehicles in Household Comparison
Tongans
Greeks
63.5%
2 OR MORE VEHICLES IN HOUSEHOLD
100.0/ 100
METRIC RATING
2nd/ 347
METRIC RANK
57.5%
2 OR MORE VEHICLES IN HOUSEHOLD
98.0/ 100
METRIC RATING
111th/ 347
METRIC RANK
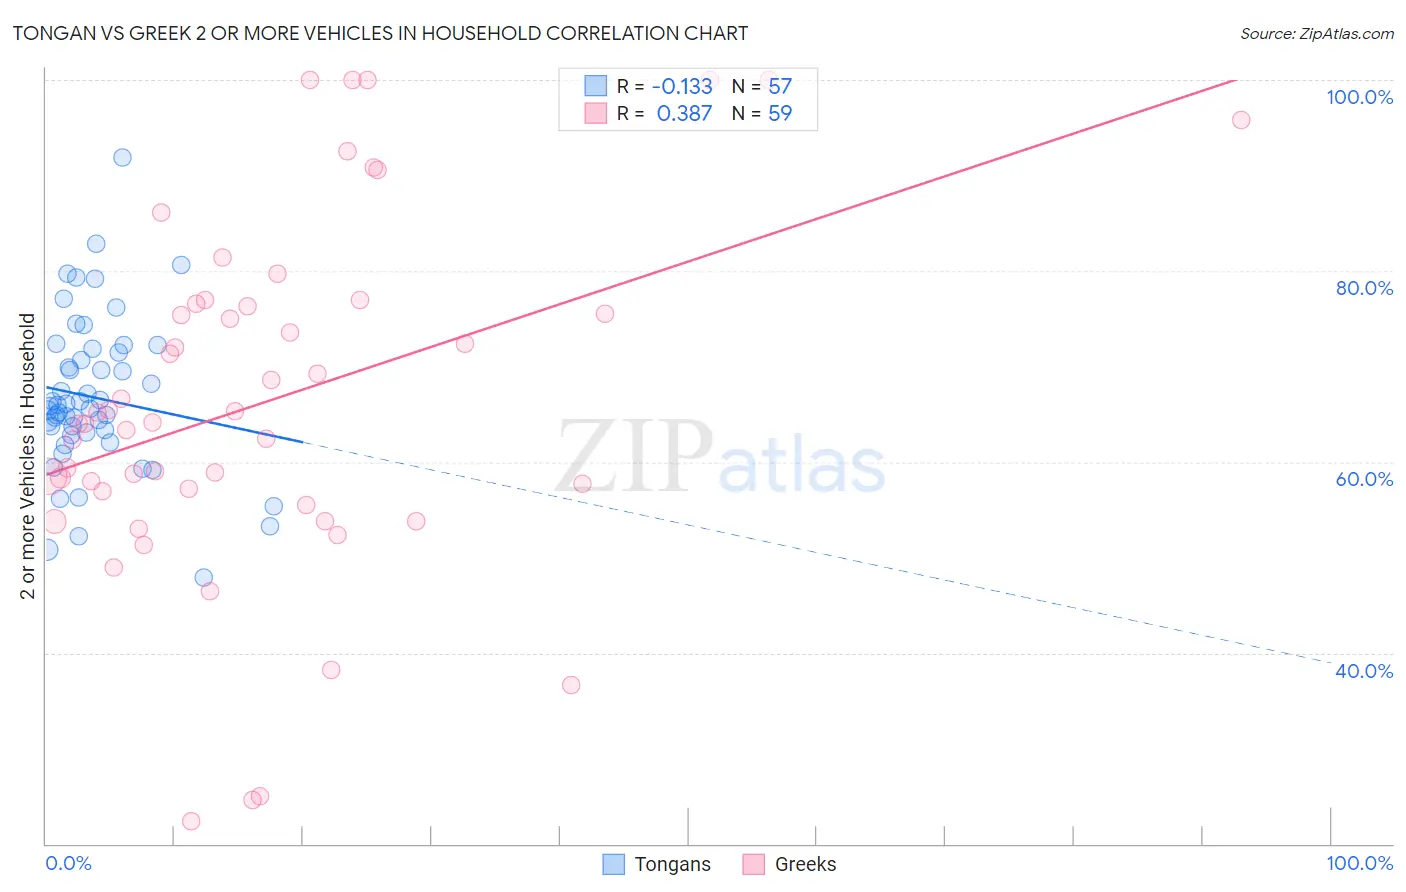
Tongan vs Greek 2 or more Vehicles in Household Correlation Chart
The statistical analysis conducted on geographies consisting of 102,873,160 people shows a poor negative correlation between the proportion of Tongans and percentage of households with 2 or more vehicles available in the United States with a correlation coefficient (R) of -0.133 and weighted average of 63.5%. Similarly, the statistical analysis conducted on geographies consisting of 482,397,984 people shows a mild positive correlation between the proportion of Greeks and percentage of households with 2 or more vehicles available in the United States with a correlation coefficient (R) of 0.387 and weighted average of 57.5%, a difference of 10.5%.
2 or more Vehicles in Household Correlation Summary
| Measurement | Tongan | Greek |
| Minimum | 47.9% | 22.4% |
| Maximum | 91.9% | 100.0% |
| Range | 44.0% | 77.6% |
| Mean | 66.7% | 66.4% |
| Median | 65.8% | 64.1% |
| Interquartile 25% (IQ1) | 63.0% | 56.9% |
| Interquartile 75% (IQ3) | 71.7% | 76.6% |
| Interquartile Range (IQR) | 8.7% | 19.7% |
| Standard Deviation (Sample) | 8.2% | 18.4% |
| Standard Deviation (Population) | 8.1% | 18.3% |
Similar Demographics by 2 or more Vehicles in Household
Demographics Similar to Tongans by 2 or more Vehicles in Household
In terms of 2 or more vehicles in household, the demographic groups most similar to Tongans are Danish (63.3%, a difference of 0.37%), Norwegian (62.8%, a difference of 1.1%), Immigrants from Fiji (62.3%, a difference of 1.9%), Yakama (64.9%, a difference of 2.2%), and Scandinavian (62.1%, a difference of 2.3%).
| Demographics | Rating | Rank | 2 or more Vehicles in Household |
| Yakama | 100.0 /100 | #1 | Exceptional 64.9% |
| Tongans | 100.0 /100 | #2 | Exceptional 63.5% |
| Danes | 100.0 /100 | #3 | Exceptional 63.3% |
| Norwegians | 100.0 /100 | #4 | Exceptional 62.8% |
| Immigrants | Fiji | 100.0 /100 | #5 | Exceptional 62.3% |
| Scandinavians | 100.0 /100 | #6 | Exceptional 62.1% |
| Puget Sound Salish | 100.0 /100 | #7 | Exceptional 62.1% |
| English | 100.0 /100 | #8 | Exceptional 61.9% |
| Swedes | 100.0 /100 | #9 | Exceptional 61.8% |
| Mexicans | 100.0 /100 | #10 | Exceptional 61.7% |
| Dutch | 100.0 /100 | #11 | Exceptional 61.6% |
| Germans | 100.0 /100 | #12 | Exceptional 61.6% |
| Samoans | 100.0 /100 | #13 | Exceptional 61.5% |
| Czechs | 100.0 /100 | #14 | Exceptional 61.5% |
| Nepalese | 100.0 /100 | #15 | Exceptional 61.4% |
Demographics Similar to Greeks by 2 or more Vehicles in Household
In terms of 2 or more vehicles in household, the demographic groups most similar to Greeks are Pueblo (57.5%, a difference of 0.0%), Japanese (57.5%, a difference of 0.030%), Immigrants from North America (57.5%, a difference of 0.050%), Immigrants from Canada (57.5%, a difference of 0.080%), and Immigrants from Netherlands (57.5%, a difference of 0.10%).
| Demographics | Rating | Rank | 2 or more Vehicles in Household |
| Immigrants | Indonesia | 98.2 /100 | #104 | Exceptional 57.6% |
| Immigrants | Korea | 98.2 /100 | #105 | Exceptional 57.6% |
| Immigrants | Oceania | 98.2 /100 | #106 | Exceptional 57.5% |
| Immigrants | Netherlands | 98.2 /100 | #107 | Exceptional 57.5% |
| Immigrants | Canada | 98.1 /100 | #108 | Exceptional 57.5% |
| Immigrants | North America | 98.1 /100 | #109 | Exceptional 57.5% |
| Japanese | 98.0 /100 | #110 | Exceptional 57.5% |
| Greeks | 98.0 /100 | #111 | Exceptional 57.5% |
| Pueblo | 98.0 /100 | #112 | Exceptional 57.5% |
| Zimbabweans | 96.9 /100 | #113 | Exceptional 57.2% |
| Immigrants | Lebanon | 96.8 /100 | #114 | Exceptional 57.2% |
| Chippewa | 96.6 /100 | #115 | Exceptional 57.2% |
| Immigrants | Jordan | 96.6 /100 | #116 | Exceptional 57.2% |
| Iraqis | 95.8 /100 | #117 | Exceptional 57.1% |
| Asians | 95.1 /100 | #118 | Exceptional 57.0% |