Fijian vs Greek 2 or more Vehicles in Household
COMPARE
Fijian
Greek
2 or more Vehicles in Household
2 or more Vehicles in Household Comparison
Fijians
Greeks
57.6%
2 OR MORE VEHICLES IN HOUSEHOLD
98.4/ 100
METRIC RATING
100th/ 347
METRIC RANK
57.5%
2 OR MORE VEHICLES IN HOUSEHOLD
98.0/ 100
METRIC RATING
111th/ 347
METRIC RANK
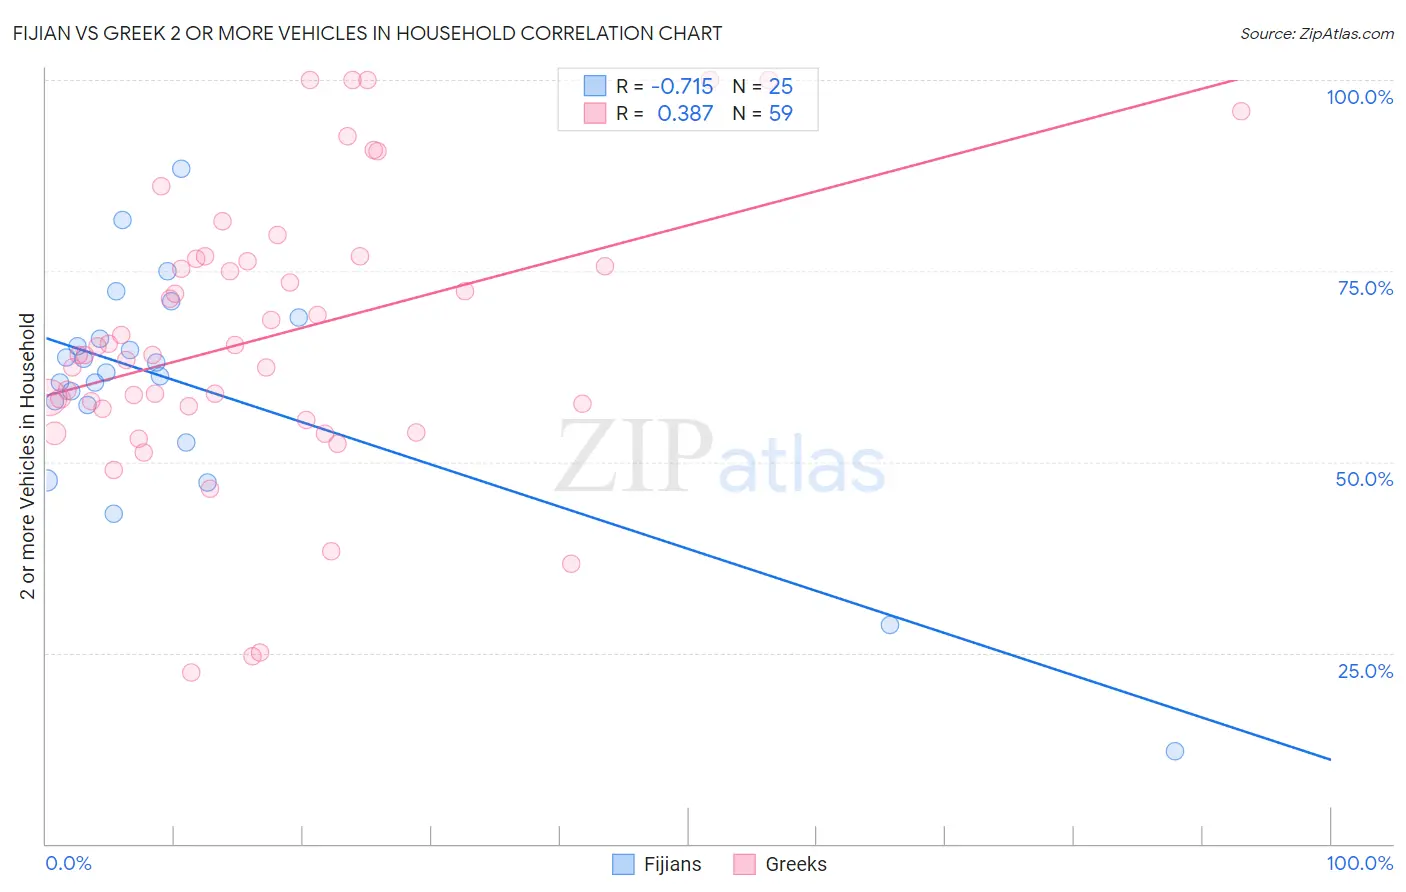
Fijian vs Greek 2 or more Vehicles in Household Correlation Chart
The statistical analysis conducted on geographies consisting of 55,948,040 people shows a strong negative correlation between the proportion of Fijians and percentage of households with 2 or more vehicles available in the United States with a correlation coefficient (R) of -0.715 and weighted average of 57.6%. Similarly, the statistical analysis conducted on geographies consisting of 482,397,984 people shows a mild positive correlation between the proportion of Greeks and percentage of households with 2 or more vehicles available in the United States with a correlation coefficient (R) of 0.387 and weighted average of 57.5%, a difference of 0.23%.
2 or more Vehicles in Household Correlation Summary
| Measurement | Fijian | Greek |
| Minimum | 12.2% | 22.4% |
| Maximum | 88.4% | 100.0% |
| Range | 76.3% | 77.6% |
| Mean | 59.7% | 66.4% |
| Median | 61.6% | 64.1% |
| Interquartile 25% (IQ1) | 54.9% | 56.9% |
| Interquartile 75% (IQ3) | 67.6% | 76.6% |
| Interquartile Range (IQR) | 12.6% | 19.7% |
| Standard Deviation (Sample) | 15.7% | 18.4% |
| Standard Deviation (Population) | 15.4% | 18.3% |
Demographics Similar to Fijians and Greeks by 2 or more Vehicles in Household
In terms of 2 or more vehicles in household, the demographic groups most similar to Fijians are Lebanese (57.6%, a difference of 0.050%), Cajun (57.7%, a difference of 0.070%), Immigrants from Bolivia (57.6%, a difference of 0.090%), Jordanian (57.6%, a difference of 0.10%), and Immigrants from Indonesia (57.6%, a difference of 0.10%). Similarly, the demographic groups most similar to Greeks are Pueblo (57.5%, a difference of 0.0%), Japanese (57.5%, a difference of 0.030%), Immigrants from North America (57.5%, a difference of 0.050%), Immigrants from Canada (57.5%, a difference of 0.080%), and Immigrants from Netherlands (57.5%, a difference of 0.10%).
| Demographics | Rating | Rank | 2 or more Vehicles in Household |
| Hmong | 98.9 /100 | #95 | Exceptional 57.8% |
| Burmese | 98.8 /100 | #96 | Exceptional 57.8% |
| Slavs | 98.8 /100 | #97 | Exceptional 57.8% |
| Palestinians | 98.6 /100 | #98 | Exceptional 57.7% |
| Cajuns | 98.5 /100 | #99 | Exceptional 57.7% |
| Fijians | 98.4 /100 | #100 | Exceptional 57.6% |
| Lebanese | 98.3 /100 | #101 | Exceptional 57.6% |
| Immigrants | Bolivia | 98.2 /100 | #102 | Exceptional 57.6% |
| Jordanians | 98.2 /100 | #103 | Exceptional 57.6% |
| Immigrants | Indonesia | 98.2 /100 | #104 | Exceptional 57.6% |
| Immigrants | Korea | 98.2 /100 | #105 | Exceptional 57.6% |
| Immigrants | Oceania | 98.2 /100 | #106 | Exceptional 57.5% |
| Immigrants | Netherlands | 98.2 /100 | #107 | Exceptional 57.5% |
| Immigrants | Canada | 98.1 /100 | #108 | Exceptional 57.5% |
| Immigrants | North America | 98.1 /100 | #109 | Exceptional 57.5% |
| Japanese | 98.0 /100 | #110 | Exceptional 57.5% |
| Greeks | 98.0 /100 | #111 | Exceptional 57.5% |
| Pueblo | 98.0 /100 | #112 | Exceptional 57.5% |
| Zimbabweans | 96.9 /100 | #113 | Exceptional 57.2% |
| Immigrants | Lebanon | 96.8 /100 | #114 | Exceptional 57.2% |
| Chippewa | 96.6 /100 | #115 | Exceptional 57.2% |