New Zealander vs Immigrants from England 2 or more Vehicles in Household
COMPARE
New Zealander
Immigrants from England
2 or more Vehicles in Household
2 or more Vehicles in Household Comparison
New Zealanders
Immigrants from England
56.7%
2 OR MORE VEHICLES IN HOUSEHOLD
91.8/ 100
METRIC RATING
124th/ 347
METRIC RANK
58.1%
2 OR MORE VEHICLES IN HOUSEHOLD
99.3/ 100
METRIC RATING
80th/ 347
METRIC RANK
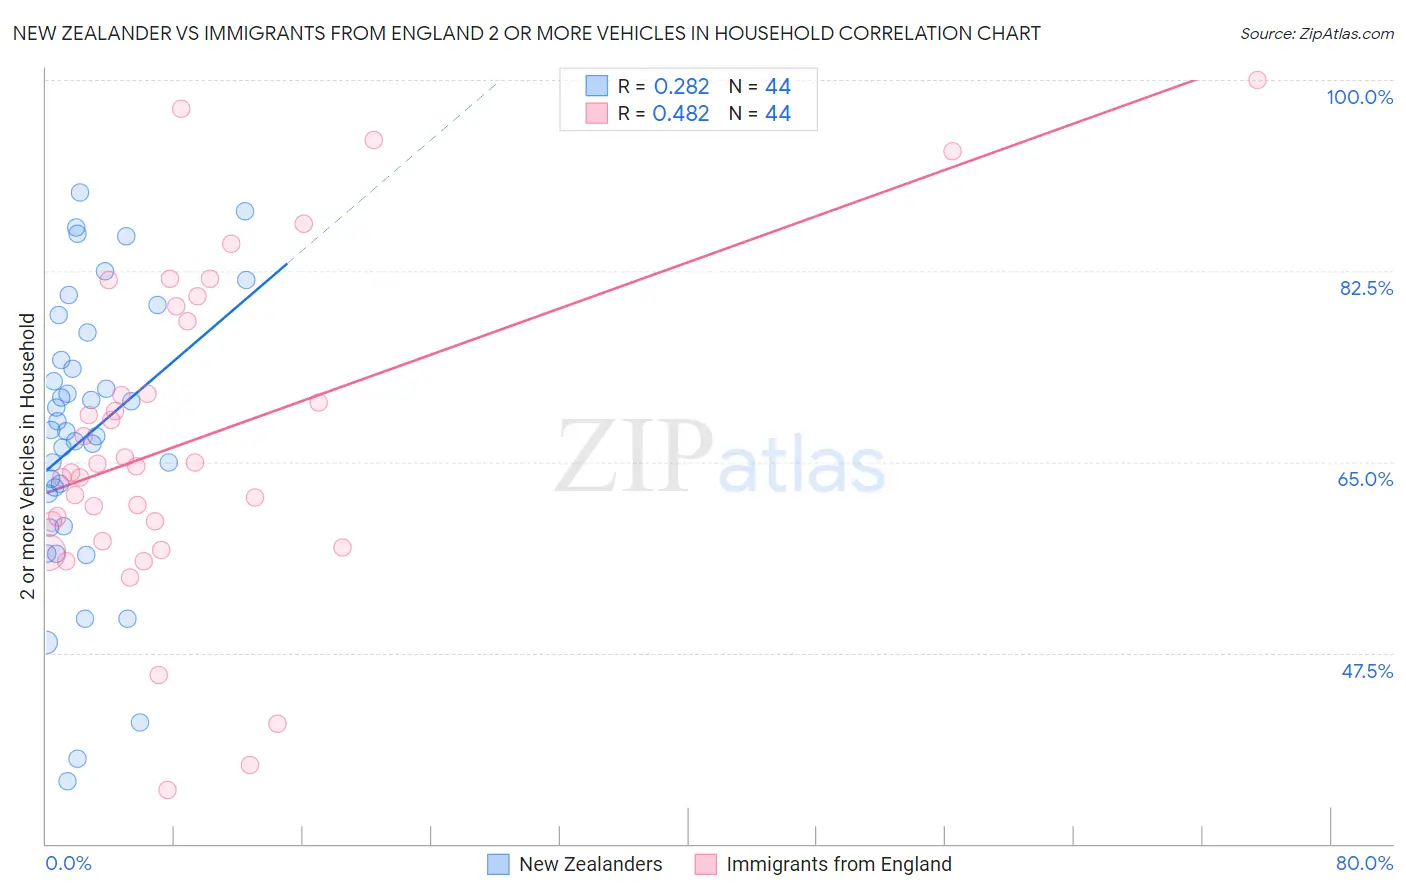
New Zealander vs Immigrants from England 2 or more Vehicles in Household Correlation Chart
The statistical analysis conducted on geographies consisting of 106,900,392 people shows a weak positive correlation between the proportion of New Zealanders and percentage of households with 2 or more vehicles available in the United States with a correlation coefficient (R) of 0.282 and weighted average of 56.7%. Similarly, the statistical analysis conducted on geographies consisting of 391,775,119 people shows a moderate positive correlation between the proportion of Immigrants from England and percentage of households with 2 or more vehicles available in the United States with a correlation coefficient (R) of 0.482 and weighted average of 58.1%, a difference of 2.5%.
2 or more Vehicles in Household Correlation Summary
| Measurement | New Zealander | Immigrants from England |
| Minimum | 35.8% | 34.9% |
| Maximum | 89.7% | 100.0% |
| Range | 53.9% | 65.1% |
| Mean | 67.4% | 67.2% |
| Median | 67.9% | 64.7% |
| Interquartile 25% (IQ1) | 60.6% | 58.6% |
| Interquartile 75% (IQ3) | 75.6% | 78.6% |
| Interquartile Range (IQR) | 15.0% | 19.9% |
| Standard Deviation (Sample) | 12.9% | 14.9% |
| Standard Deviation (Population) | 12.8% | 14.7% |
Similar Demographics by 2 or more Vehicles in Household
Demographics Similar to New Zealanders by 2 or more Vehicles in Household
In terms of 2 or more vehicles in household, the demographic groups most similar to New Zealanders are Australian (56.7%, a difference of 0.0%), Tsimshian (56.7%, a difference of 0.020%), Immigrants from South Africa (56.7%, a difference of 0.10%), Estonian (56.6%, a difference of 0.10%), and Immigrants from Thailand (56.6%, a difference of 0.13%).
| Demographics | Rating | Rank | 2 or more Vehicles in Household |
| Iraqis | 95.8 /100 | #117 | Exceptional 57.1% |
| Asians | 95.1 /100 | #118 | Exceptional 57.0% |
| Natives/Alaskans | 95.0 /100 | #119 | Exceptional 57.0% |
| Costa Ricans | 94.7 /100 | #120 | Exceptional 56.9% |
| Sioux | 93.8 /100 | #121 | Exceptional 56.8% |
| Immigrants | South Africa | 92.5 /100 | #122 | Exceptional 56.7% |
| Australians | 91.8 /100 | #123 | Exceptional 56.7% |
| New Zealanders | 91.8 /100 | #124 | Exceptional 56.7% |
| Tsimshian | 91.6 /100 | #125 | Exceptional 56.7% |
| Estonians | 90.9 /100 | #126 | Exceptional 56.6% |
| Immigrants | Thailand | 90.7 /100 | #127 | Exceptional 56.6% |
| Immigrants | South Central Asia | 90.5 /100 | #128 | Exceptional 56.6% |
| Ute | 90.4 /100 | #129 | Exceptional 56.6% |
| Yugoslavians | 90.0 /100 | #130 | Exceptional 56.6% |
| Bulgarians | 89.7 /100 | #131 | Excellent 56.5% |
Demographics Similar to Immigrants from England by 2 or more Vehicles in Household
In terms of 2 or more vehicles in household, the demographic groups most similar to Immigrants from England are Immigrants from Iraq (58.1%, a difference of 0.010%), Iranian (58.1%, a difference of 0.10%), Delaware (58.2%, a difference of 0.14%), Icelander (58.0%, a difference of 0.14%), and Maltese (58.0%, a difference of 0.17%).
| Demographics | Rating | Rank | 2 or more Vehicles in Household |
| Bolivians | 99.6 /100 | #73 | Exceptional 58.3% |
| Immigrants | Afghanistan | 99.6 /100 | #74 | Exceptional 58.3% |
| Poles | 99.5 /100 | #75 | Exceptional 58.3% |
| Creek | 99.5 /100 | #76 | Exceptional 58.3% |
| Slovenes | 99.5 /100 | #77 | Exceptional 58.3% |
| Lithuanians | 99.5 /100 | #78 | Exceptional 58.2% |
| Delaware | 99.4 /100 | #79 | Exceptional 58.2% |
| Immigrants | England | 99.3 /100 | #80 | Exceptional 58.1% |
| Immigrants | Iraq | 99.3 /100 | #81 | Exceptional 58.1% |
| Iranians | 99.3 /100 | #82 | Exceptional 58.1% |
| Icelanders | 99.2 /100 | #83 | Exceptional 58.0% |
| Maltese | 99.2 /100 | #84 | Exceptional 58.0% |
| Slovaks | 99.2 /100 | #85 | Exceptional 58.0% |
| Potawatomi | 99.1 /100 | #86 | Exceptional 58.0% |
| Thais | 99.1 /100 | #87 | Exceptional 57.9% |