Irish vs Greek 2 or more Vehicles in Household
COMPARE
Irish
Greek
2 or more Vehicles in Household
2 or more Vehicles in Household Comparison
Irish
Greeks
60.1%
2 OR MORE VEHICLES IN HOUSEHOLD
100.0/ 100
METRIC RATING
37th/ 347
METRIC RANK
57.5%
2 OR MORE VEHICLES IN HOUSEHOLD
98.0/ 100
METRIC RATING
111th/ 347
METRIC RANK
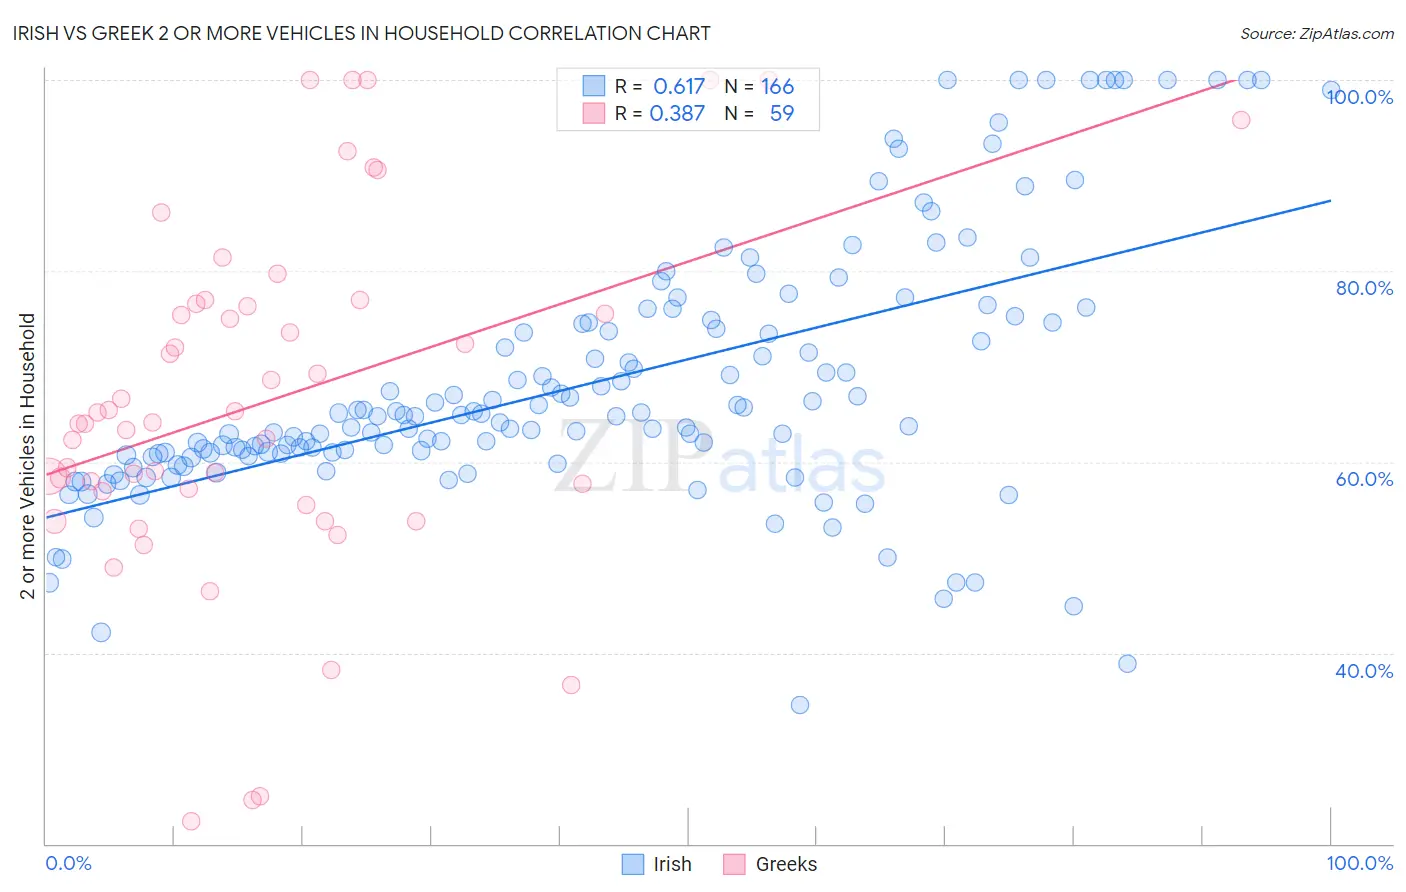
Irish vs Greek 2 or more Vehicles in Household Correlation Chart
The statistical analysis conducted on geographies consisting of 580,068,554 people shows a significant positive correlation between the proportion of Irish and percentage of households with 2 or more vehicles available in the United States with a correlation coefficient (R) of 0.617 and weighted average of 60.1%. Similarly, the statistical analysis conducted on geographies consisting of 482,397,984 people shows a mild positive correlation between the proportion of Greeks and percentage of households with 2 or more vehicles available in the United States with a correlation coefficient (R) of 0.387 and weighted average of 57.5%, a difference of 4.5%.
2 or more Vehicles in Household Correlation Summary
| Measurement | Irish | Greek |
| Minimum | 34.5% | 22.4% |
| Maximum | 100.0% | 100.0% |
| Range | 65.5% | 77.6% |
| Mean | 68.2% | 66.4% |
| Median | 64.8% | 64.1% |
| Interquartile 25% (IQ1) | 60.9% | 56.9% |
| Interquartile 75% (IQ3) | 74.6% | 76.6% |
| Interquartile Range (IQR) | 13.7% | 19.7% |
| Standard Deviation (Sample) | 13.6% | 18.4% |
| Standard Deviation (Population) | 13.5% | 18.3% |
Similar Demographics by 2 or more Vehicles in Household
Demographics Similar to Irish by 2 or more Vehicles in Household
In terms of 2 or more vehicles in household, the demographic groups most similar to Irish are Chinese (60.1%, a difference of 0.030%), Immigrants from Philippines (60.1%, a difference of 0.060%), American (60.0%, a difference of 0.060%), British (60.0%, a difference of 0.070%), and Spanish (60.2%, a difference of 0.18%).
| Demographics | Rating | Rank | 2 or more Vehicles in Household |
| Finns | 100.0 /100 | #30 | Exceptional 60.3% |
| Spanish American Indians | 100.0 /100 | #31 | Exceptional 60.3% |
| Arapaho | 100.0 /100 | #32 | Exceptional 60.2% |
| Immigrants | Mexico | 100.0 /100 | #33 | Exceptional 60.2% |
| Spanish | 100.0 /100 | #34 | Exceptional 60.2% |
| Immigrants | Philippines | 100.0 /100 | #35 | Exceptional 60.1% |
| Chinese | 100.0 /100 | #36 | Exceptional 60.1% |
| Irish | 100.0 /100 | #37 | Exceptional 60.1% |
| Americans | 100.0 /100 | #38 | Exceptional 60.0% |
| British | 100.0 /100 | #39 | Exceptional 60.0% |
| Cherokee | 100.0 /100 | #40 | Exceptional 59.9% |
| Northern Europeans | 100.0 /100 | #41 | Exceptional 59.9% |
| Malaysians | 100.0 /100 | #42 | Exceptional 59.8% |
| Czechoslovakians | 100.0 /100 | #43 | Exceptional 59.8% |
| French | 100.0 /100 | #44 | Exceptional 59.8% |
Demographics Similar to Greeks by 2 or more Vehicles in Household
In terms of 2 or more vehicles in household, the demographic groups most similar to Greeks are Pueblo (57.5%, a difference of 0.0%), Japanese (57.5%, a difference of 0.030%), Immigrants from North America (57.5%, a difference of 0.050%), Immigrants from Canada (57.5%, a difference of 0.080%), and Immigrants from Netherlands (57.5%, a difference of 0.10%).
| Demographics | Rating | Rank | 2 or more Vehicles in Household |
| Immigrants | Indonesia | 98.2 /100 | #104 | Exceptional 57.6% |
| Immigrants | Korea | 98.2 /100 | #105 | Exceptional 57.6% |
| Immigrants | Oceania | 98.2 /100 | #106 | Exceptional 57.5% |
| Immigrants | Netherlands | 98.2 /100 | #107 | Exceptional 57.5% |
| Immigrants | Canada | 98.1 /100 | #108 | Exceptional 57.5% |
| Immigrants | North America | 98.1 /100 | #109 | Exceptional 57.5% |
| Japanese | 98.0 /100 | #110 | Exceptional 57.5% |
| Greeks | 98.0 /100 | #111 | Exceptional 57.5% |
| Pueblo | 98.0 /100 | #112 | Exceptional 57.5% |
| Zimbabweans | 96.9 /100 | #113 | Exceptional 57.2% |
| Immigrants | Lebanon | 96.8 /100 | #114 | Exceptional 57.2% |
| Chippewa | 96.6 /100 | #115 | Exceptional 57.2% |
| Immigrants | Jordan | 96.6 /100 | #116 | Exceptional 57.2% |
| Iraqis | 95.8 /100 | #117 | Exceptional 57.1% |
| Asians | 95.1 /100 | #118 | Exceptional 57.0% |