New Zealander vs Greek 1 or more Vehicles in Household
COMPARE
New Zealander
Greek
1 or more Vehicles in Household
1 or more Vehicles in Household Comparison
New Zealanders
Greeks
90.1%
1 OR MORE VEHICLES IN HOUSEHOLD
73.8/ 100
METRIC RATING
153rd/ 347
METRIC RANK
90.6%
1 OR MORE VEHICLES IN HOUSEHOLD
93.5/ 100
METRIC RATING
117th/ 347
METRIC RANK
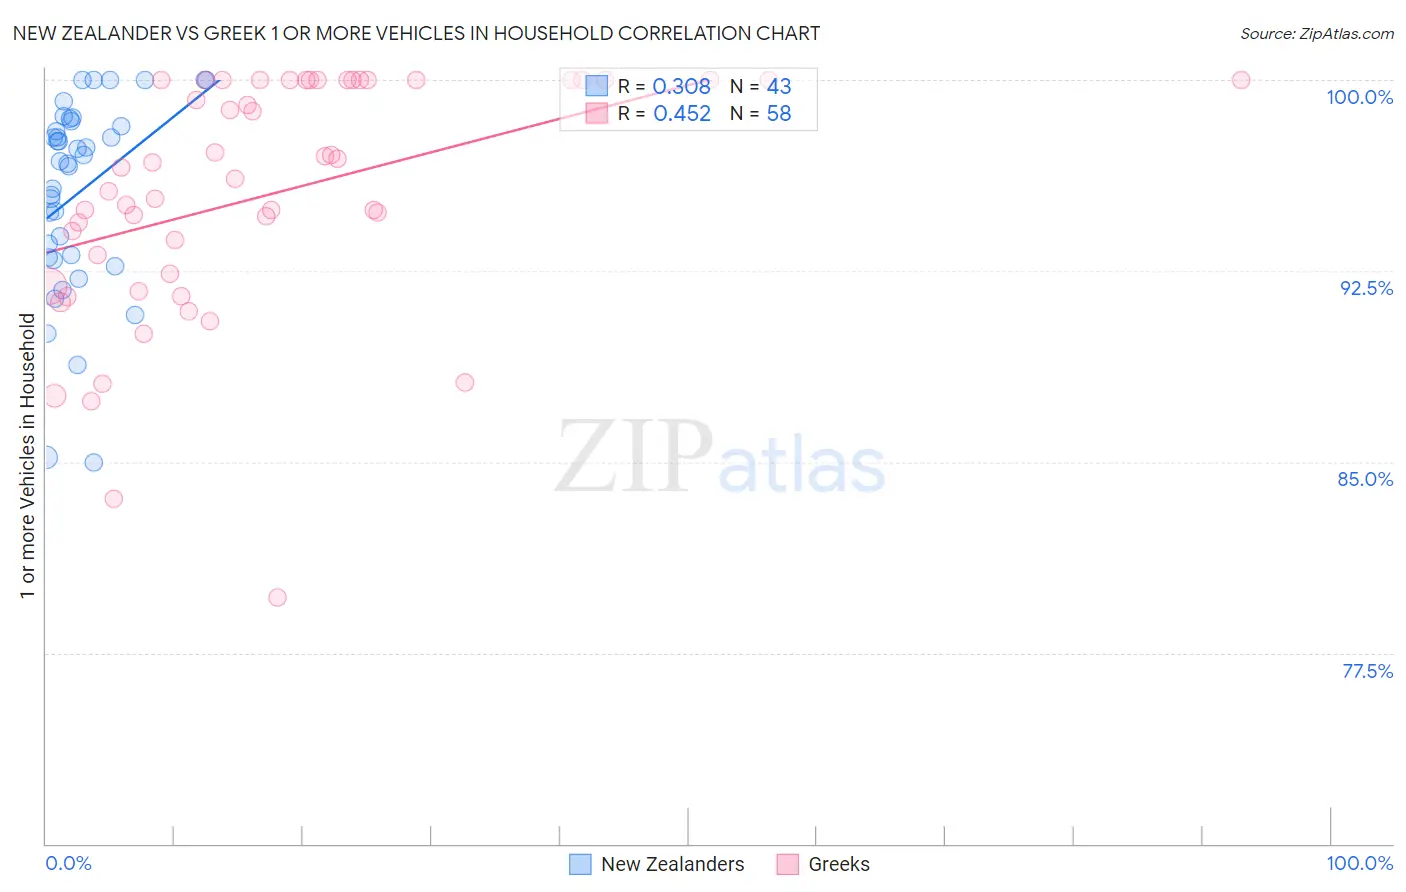
New Zealander vs Greek 1 or more Vehicles in Household Correlation Chart
The statistical analysis conducted on geographies consisting of 106,884,336 people shows a mild positive correlation between the proportion of New Zealanders and percentage of households with 1 or more vehicles available in the United States with a correlation coefficient (R) of 0.308 and weighted average of 90.1%. Similarly, the statistical analysis conducted on geographies consisting of 482,364,894 people shows a moderate positive correlation between the proportion of Greeks and percentage of households with 1 or more vehicles available in the United States with a correlation coefficient (R) of 0.452 and weighted average of 90.6%, a difference of 0.63%.
1 or more Vehicles in Household Correlation Summary
| Measurement | New Zealander | Greek |
| Minimum | 85.0% | 79.7% |
| Maximum | 100.0% | 100.0% |
| Range | 15.0% | 20.3% |
| Mean | 95.6% | 95.5% |
| Median | 96.8% | 96.3% |
| Interquartile 25% (IQ1) | 93.0% | 92.4% |
| Interquartile 75% (IQ3) | 98.4% | 100.0% |
| Interquartile Range (IQR) | 5.4% | 7.6% |
| Standard Deviation (Sample) | 3.8% | 4.7% |
| Standard Deviation (Population) | 3.8% | 4.7% |
Similar Demographics by 1 or more Vehicles in Household
Demographics Similar to New Zealanders by 1 or more Vehicles in Household
In terms of 1 or more vehicles in household, the demographic groups most similar to New Zealanders are Immigrants from Uganda (90.1%, a difference of 0.0%), Immigrants (90.1%, a difference of 0.0%), Tlingit-Haida (90.1%, a difference of 0.010%), Immigrants from Bosnia and Herzegovina (90.1%, a difference of 0.030%), and Australian (90.0%, a difference of 0.030%).
| Demographics | Rating | Rank | 1 or more Vehicles in Household |
| Bahamians | 80.5 /100 | #146 | Excellent 90.2% |
| Chileans | 79.8 /100 | #147 | Good 90.2% |
| Immigrants | Eastern Africa | 78.2 /100 | #148 | Good 90.1% |
| Immigrants | Nicaragua | 76.7 /100 | #149 | Good 90.1% |
| Immigrants | Micronesia | 75.9 /100 | #150 | Good 90.1% |
| Immigrants | Bosnia and Herzegovina | 75.4 /100 | #151 | Good 90.1% |
| Tlingit-Haida | 74.3 /100 | #152 | Good 90.1% |
| New Zealanders | 73.8 /100 | #153 | Good 90.1% |
| Immigrants | Uganda | 73.8 /100 | #154 | Good 90.1% |
| Immigrants | Immigrants | 73.6 /100 | #155 | Good 90.1% |
| Australians | 72.4 /100 | #156 | Good 90.0% |
| Immigrants | Congo | 71.2 /100 | #157 | Good 90.0% |
| Brazilians | 71.0 /100 | #158 | Good 90.0% |
| South Africans | 69.7 /100 | #159 | Good 90.0% |
| Immigrants | Indonesia | 68.8 /100 | #160 | Good 90.0% |
Demographics Similar to Greeks by 1 or more Vehicles in Household
In terms of 1 or more vehicles in household, the demographic groups most similar to Greeks are Japanese (90.6%, a difference of 0.010%), Serbian (90.7%, a difference of 0.050%), Chippewa (90.7%, a difference of 0.050%), Blackfeet (90.6%, a difference of 0.050%), and Armenian (90.7%, a difference of 0.070%).
| Demographics | Rating | Rank | 1 or more Vehicles in Household |
| Mexican American Indians | 97.4 /100 | #110 | Exceptional 91.0% |
| Navajo | 95.8 /100 | #111 | Exceptional 90.8% |
| Immigrants | Netherlands | 95.7 /100 | #112 | Exceptional 90.8% |
| Immigrants | Kuwait | 94.7 /100 | #113 | Exceptional 90.7% |
| Armenians | 94.5 /100 | #114 | Exceptional 90.7% |
| Serbians | 94.3 /100 | #115 | Exceptional 90.7% |
| Chippewa | 94.3 /100 | #116 | Exceptional 90.7% |
| Greeks | 93.5 /100 | #117 | Exceptional 90.6% |
| Japanese | 93.4 /100 | #118 | Exceptional 90.6% |
| Blackfeet | 92.6 /100 | #119 | Exceptional 90.6% |
| Immigrants | Thailand | 92.3 /100 | #120 | Exceptional 90.6% |
| Icelanders | 92.1 /100 | #121 | Exceptional 90.5% |
| Costa Ricans | 92.0 /100 | #122 | Exceptional 90.5% |
| Fijians | 91.8 /100 | #123 | Exceptional 90.5% |
| Puget Sound Salish | 91.5 /100 | #124 | Exceptional 90.5% |