Immigrants from Malaysia vs Greek 2 or more Vehicles in Household
COMPARE
Immigrants from Malaysia
Greek
2 or more Vehicles in Household
2 or more Vehicles in Household Comparison
Immigrants from Malaysia
Greeks
52.7%
2 OR MORE VEHICLES IN HOUSEHOLD
0.8/ 100
METRIC RATING
254th/ 347
METRIC RANK
57.5%
2 OR MORE VEHICLES IN HOUSEHOLD
98.0/ 100
METRIC RATING
111th/ 347
METRIC RANK
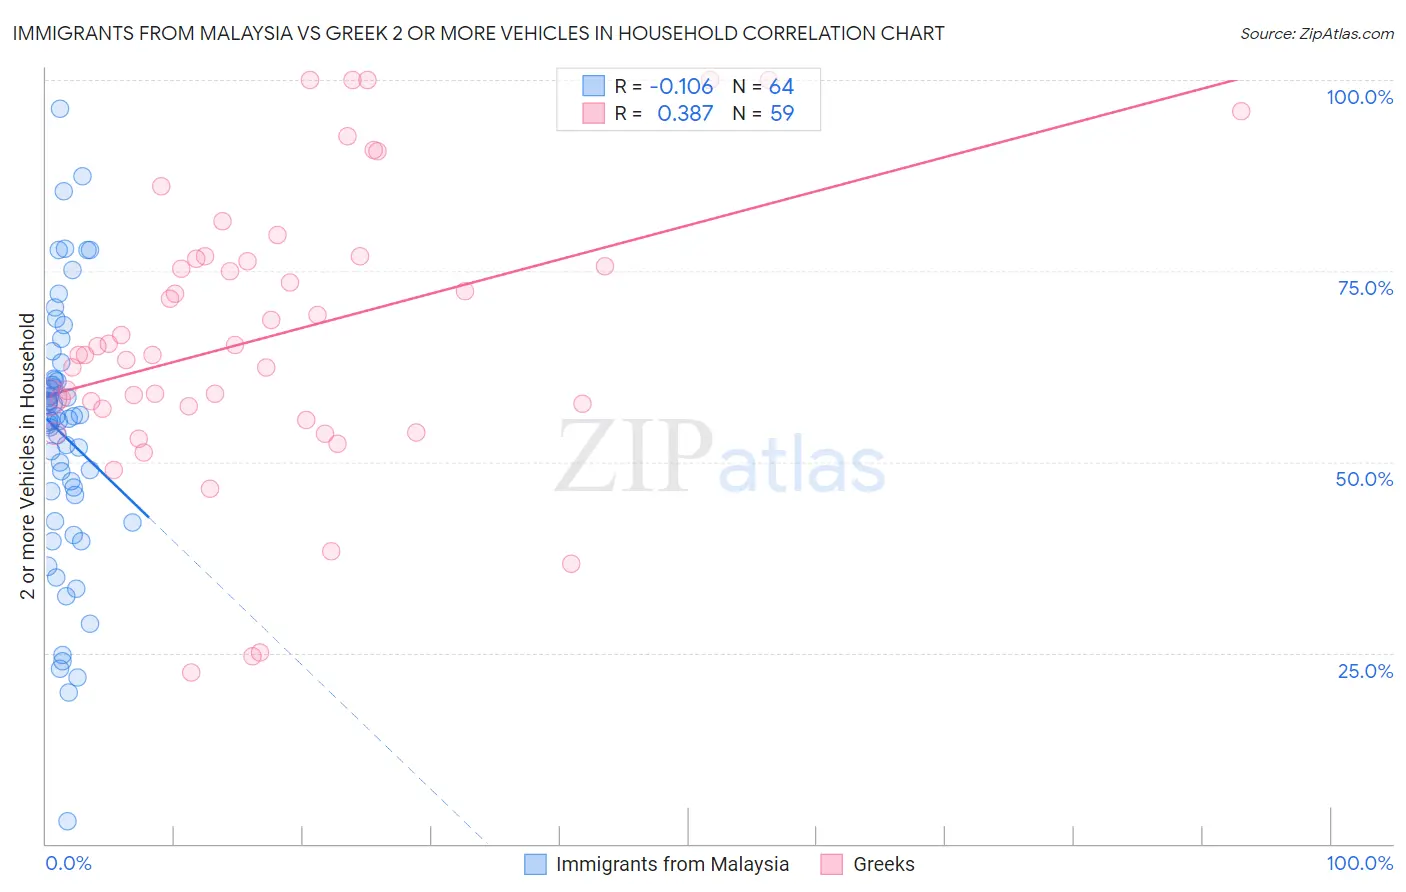
Immigrants from Malaysia vs Greek 2 or more Vehicles in Household Correlation Chart
The statistical analysis conducted on geographies consisting of 197,930,354 people shows a poor negative correlation between the proportion of Immigrants from Malaysia and percentage of households with 2 or more vehicles available in the United States with a correlation coefficient (R) of -0.106 and weighted average of 52.7%. Similarly, the statistical analysis conducted on geographies consisting of 482,397,984 people shows a mild positive correlation between the proportion of Greeks and percentage of households with 2 or more vehicles available in the United States with a correlation coefficient (R) of 0.387 and weighted average of 57.5%, a difference of 9.1%.
2 or more Vehicles in Household Correlation Summary
| Measurement | Immigrants from Malaysia | Greek |
| Minimum | 2.9% | 22.4% |
| Maximum | 96.2% | 100.0% |
| Range | 93.3% | 77.6% |
| Mean | 53.5% | 66.4% |
| Median | 55.5% | 64.1% |
| Interquartile 25% (IQ1) | 43.9% | 56.9% |
| Interquartile 75% (IQ3) | 60.8% | 76.6% |
| Interquartile Range (IQR) | 16.9% | 19.7% |
| Standard Deviation (Sample) | 17.5% | 18.4% |
| Standard Deviation (Population) | 17.3% | 18.3% |
Similar Demographics by 2 or more Vehicles in Household
Demographics Similar to Immigrants from Malaysia by 2 or more Vehicles in Household
In terms of 2 or more vehicles in household, the demographic groups most similar to Immigrants from Malaysia are Uruguayan (52.7%, a difference of 0.030%), Immigrants from Eritrea (52.6%, a difference of 0.070%), Nigerian (52.8%, a difference of 0.19%), Immigrants from Hong Kong (52.6%, a difference of 0.21%), and Immigrants from Portugal (52.8%, a difference of 0.24%).
| Demographics | Rating | Rank | 2 or more Vehicles in Household |
| Sierra Leoneans | 1.2 /100 | #247 | Tragic 52.9% |
| Colombians | 1.1 /100 | #248 | Tragic 52.9% |
| Immigrants | Brazil | 1.0 /100 | #249 | Tragic 52.8% |
| Mongolians | 1.0 /100 | #250 | Tragic 52.8% |
| Immigrants | Sudan | 1.0 /100 | #251 | Tragic 52.8% |
| Immigrants | Portugal | 1.0 /100 | #252 | Tragic 52.8% |
| Nigerians | 0.9 /100 | #253 | Tragic 52.8% |
| Immigrants | Malaysia | 0.8 /100 | #254 | Tragic 52.7% |
| Uruguayans | 0.7 /100 | #255 | Tragic 52.7% |
| Immigrants | Eritrea | 0.7 /100 | #256 | Tragic 52.6% |
| Immigrants | Hong Kong | 0.6 /100 | #257 | Tragic 52.6% |
| Central American Indians | 0.6 /100 | #258 | Tragic 52.5% |
| Alsatians | 0.6 /100 | #259 | Tragic 52.5% |
| Immigrants | Bahamas | 0.5 /100 | #260 | Tragic 52.5% |
| Immigrants | Australia | 0.5 /100 | #261 | Tragic 52.4% |
Demographics Similar to Greeks by 2 or more Vehicles in Household
In terms of 2 or more vehicles in household, the demographic groups most similar to Greeks are Pueblo (57.5%, a difference of 0.0%), Japanese (57.5%, a difference of 0.030%), Immigrants from North America (57.5%, a difference of 0.050%), Immigrants from Canada (57.5%, a difference of 0.080%), and Immigrants from Netherlands (57.5%, a difference of 0.10%).
| Demographics | Rating | Rank | 2 or more Vehicles in Household |
| Immigrants | Indonesia | 98.2 /100 | #104 | Exceptional 57.6% |
| Immigrants | Korea | 98.2 /100 | #105 | Exceptional 57.6% |
| Immigrants | Oceania | 98.2 /100 | #106 | Exceptional 57.5% |
| Immigrants | Netherlands | 98.2 /100 | #107 | Exceptional 57.5% |
| Immigrants | Canada | 98.1 /100 | #108 | Exceptional 57.5% |
| Immigrants | North America | 98.1 /100 | #109 | Exceptional 57.5% |
| Japanese | 98.0 /100 | #110 | Exceptional 57.5% |
| Greeks | 98.0 /100 | #111 | Exceptional 57.5% |
| Pueblo | 98.0 /100 | #112 | Exceptional 57.5% |
| Zimbabweans | 96.9 /100 | #113 | Exceptional 57.2% |
| Immigrants | Lebanon | 96.8 /100 | #114 | Exceptional 57.2% |
| Chippewa | 96.6 /100 | #115 | Exceptional 57.2% |
| Immigrants | Jordan | 96.6 /100 | #116 | Exceptional 57.2% |
| Iraqis | 95.8 /100 | #117 | Exceptional 57.1% |
| Asians | 95.1 /100 | #118 | Exceptional 57.0% |