New Zealander vs Immigrants from Cameroon 2 or more Vehicles in Household
COMPARE
New Zealander
Immigrants from Cameroon
2 or more Vehicles in Household
2 or more Vehicles in Household Comparison
New Zealanders
Immigrants from Cameroon
56.7%
2 OR MORE VEHICLES IN HOUSEHOLD
91.8/ 100
METRIC RATING
124th/ 347
METRIC RANK
55.1%
2 OR MORE VEHICLES IN HOUSEHOLD
37.3/ 100
METRIC RATING
183rd/ 347
METRIC RANK
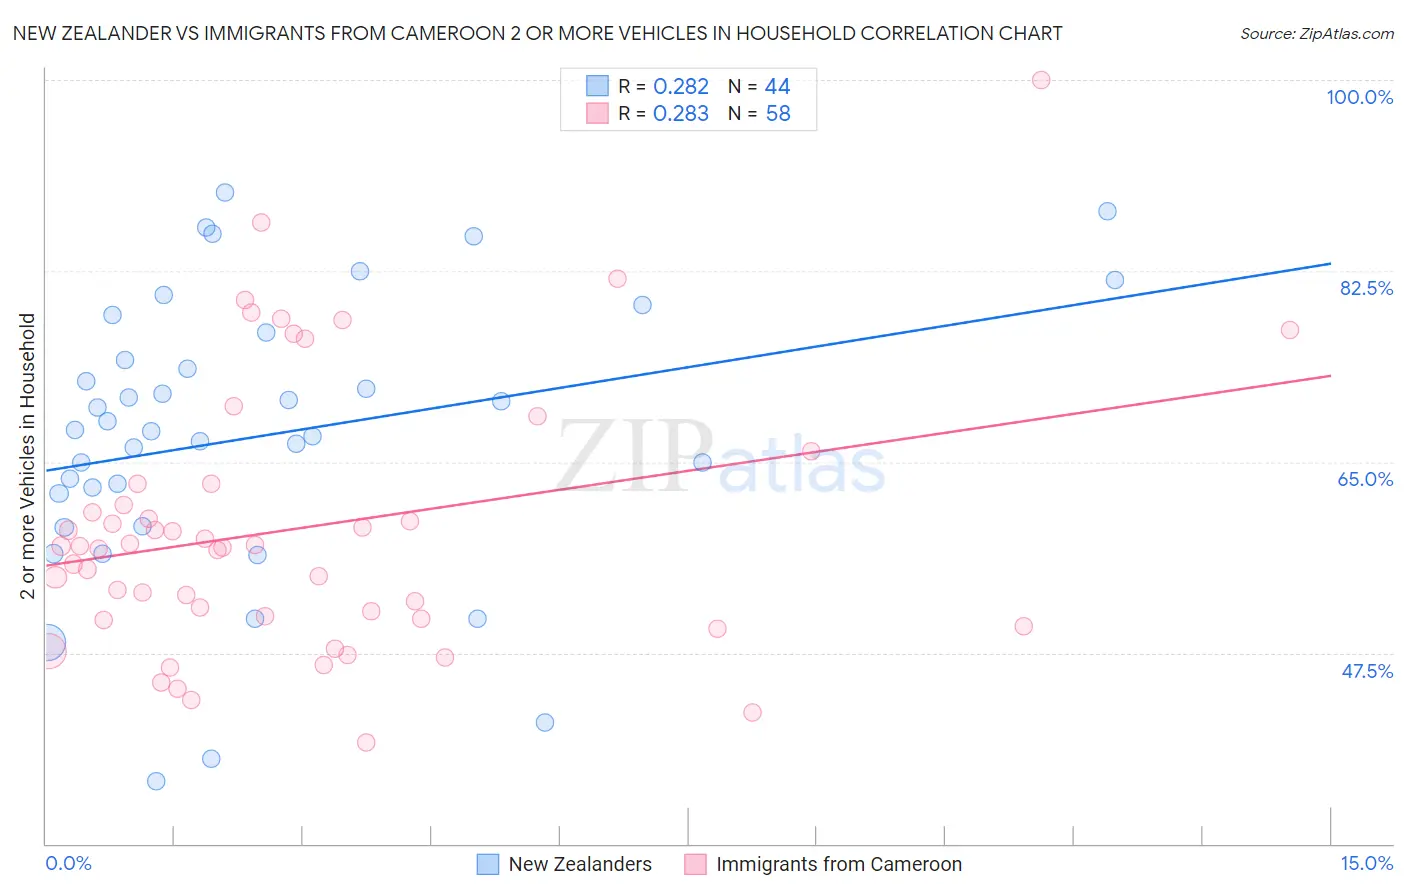
New Zealander vs Immigrants from Cameroon 2 or more Vehicles in Household Correlation Chart
The statistical analysis conducted on geographies consisting of 106,900,392 people shows a weak positive correlation between the proportion of New Zealanders and percentage of households with 2 or more vehicles available in the United States with a correlation coefficient (R) of 0.282 and weighted average of 56.7%. Similarly, the statistical analysis conducted on geographies consisting of 130,742,735 people shows a weak positive correlation between the proportion of Immigrants from Cameroon and percentage of households with 2 or more vehicles available in the United States with a correlation coefficient (R) of 0.283 and weighted average of 55.1%, a difference of 2.9%.
2 or more Vehicles in Household Correlation Summary
| Measurement | New Zealander | Immigrants from Cameroon |
| Minimum | 35.8% | 39.2% |
| Maximum | 89.7% | 100.0% |
| Range | 53.9% | 60.8% |
| Mean | 67.4% | 59.0% |
| Median | 67.9% | 57.2% |
| Interquartile 25% (IQ1) | 60.6% | 50.7% |
| Interquartile 75% (IQ3) | 75.6% | 63.0% |
| Interquartile Range (IQR) | 15.0% | 12.3% |
| Standard Deviation (Sample) | 12.9% | 12.4% |
| Standard Deviation (Population) | 12.8% | 12.3% |
Similar Demographics by 2 or more Vehicles in Household
Demographics Similar to New Zealanders by 2 or more Vehicles in Household
In terms of 2 or more vehicles in household, the demographic groups most similar to New Zealanders are Australian (56.7%, a difference of 0.0%), Tsimshian (56.7%, a difference of 0.020%), Immigrants from South Africa (56.7%, a difference of 0.10%), Estonian (56.6%, a difference of 0.10%), and Immigrants from Thailand (56.6%, a difference of 0.13%).
| Demographics | Rating | Rank | 2 or more Vehicles in Household |
| Iraqis | 95.8 /100 | #117 | Exceptional 57.1% |
| Asians | 95.1 /100 | #118 | Exceptional 57.0% |
| Natives/Alaskans | 95.0 /100 | #119 | Exceptional 57.0% |
| Costa Ricans | 94.7 /100 | #120 | Exceptional 56.9% |
| Sioux | 93.8 /100 | #121 | Exceptional 56.8% |
| Immigrants | South Africa | 92.5 /100 | #122 | Exceptional 56.7% |
| Australians | 91.8 /100 | #123 | Exceptional 56.7% |
| New Zealanders | 91.8 /100 | #124 | Exceptional 56.7% |
| Tsimshian | 91.6 /100 | #125 | Exceptional 56.7% |
| Estonians | 90.9 /100 | #126 | Exceptional 56.6% |
| Immigrants | Thailand | 90.7 /100 | #127 | Exceptional 56.6% |
| Immigrants | South Central Asia | 90.5 /100 | #128 | Exceptional 56.6% |
| Ute | 90.4 /100 | #129 | Exceptional 56.6% |
| Yugoslavians | 90.0 /100 | #130 | Exceptional 56.6% |
| Bulgarians | 89.7 /100 | #131 | Excellent 56.5% |
Demographics Similar to Immigrants from Cameroon by 2 or more Vehicles in Household
In terms of 2 or more vehicles in household, the demographic groups most similar to Immigrants from Cameroon are Apache (55.1%, a difference of 0.030%), Immigrants from Micronesia (55.1%, a difference of 0.040%), Cree (55.1%, a difference of 0.040%), Arab (55.0%, a difference of 0.060%), and Immigrants from Kenya (55.1%, a difference of 0.13%).
| Demographics | Rating | Rank | 2 or more Vehicles in Household |
| Immigrants | Cuba | 47.0 /100 | #176 | Average 55.3% |
| Menominee | 46.2 /100 | #177 | Average 55.3% |
| Immigrants | Sweden | 45.3 /100 | #178 | Average 55.2% |
| Alaskan Athabascans | 42.9 /100 | #179 | Average 55.2% |
| Immigrants | Kenya | 40.4 /100 | #180 | Average 55.1% |
| Immigrants | Micronesia | 38.2 /100 | #181 | Fair 55.1% |
| Cree | 38.2 /100 | #182 | Fair 55.1% |
| Immigrants | Cameroon | 37.3 /100 | #183 | Fair 55.1% |
| Apache | 36.7 /100 | #184 | Fair 55.1% |
| Arabs | 35.9 /100 | #185 | Fair 55.0% |
| Peruvians | 33.7 /100 | #186 | Fair 55.0% |
| Immigrants | Uganda | 33.4 /100 | #187 | Fair 55.0% |
| Marshallese | 30.5 /100 | #188 | Fair 54.9% |
| Eastern Europeans | 27.5 /100 | #189 | Fair 54.8% |
| Russians | 26.3 /100 | #190 | Fair 54.8% |