Immigrants from Nigeria vs West Indian No Vehicles in Household
COMPARE
Immigrants from Nigeria
West Indian
No Vehicles in Household
No Vehicles in Household Comparison
Immigrants from Nigeria
West Indians
11.8%
NO VEHICLES IN HOUSEHOLD
1.9/ 100
METRIC RATING
249th/ 347
METRIC RANK
23.7%
NO VEHICLES IN HOUSEHOLD
0.0/ 100
METRIC RATING
330th/ 347
METRIC RANK
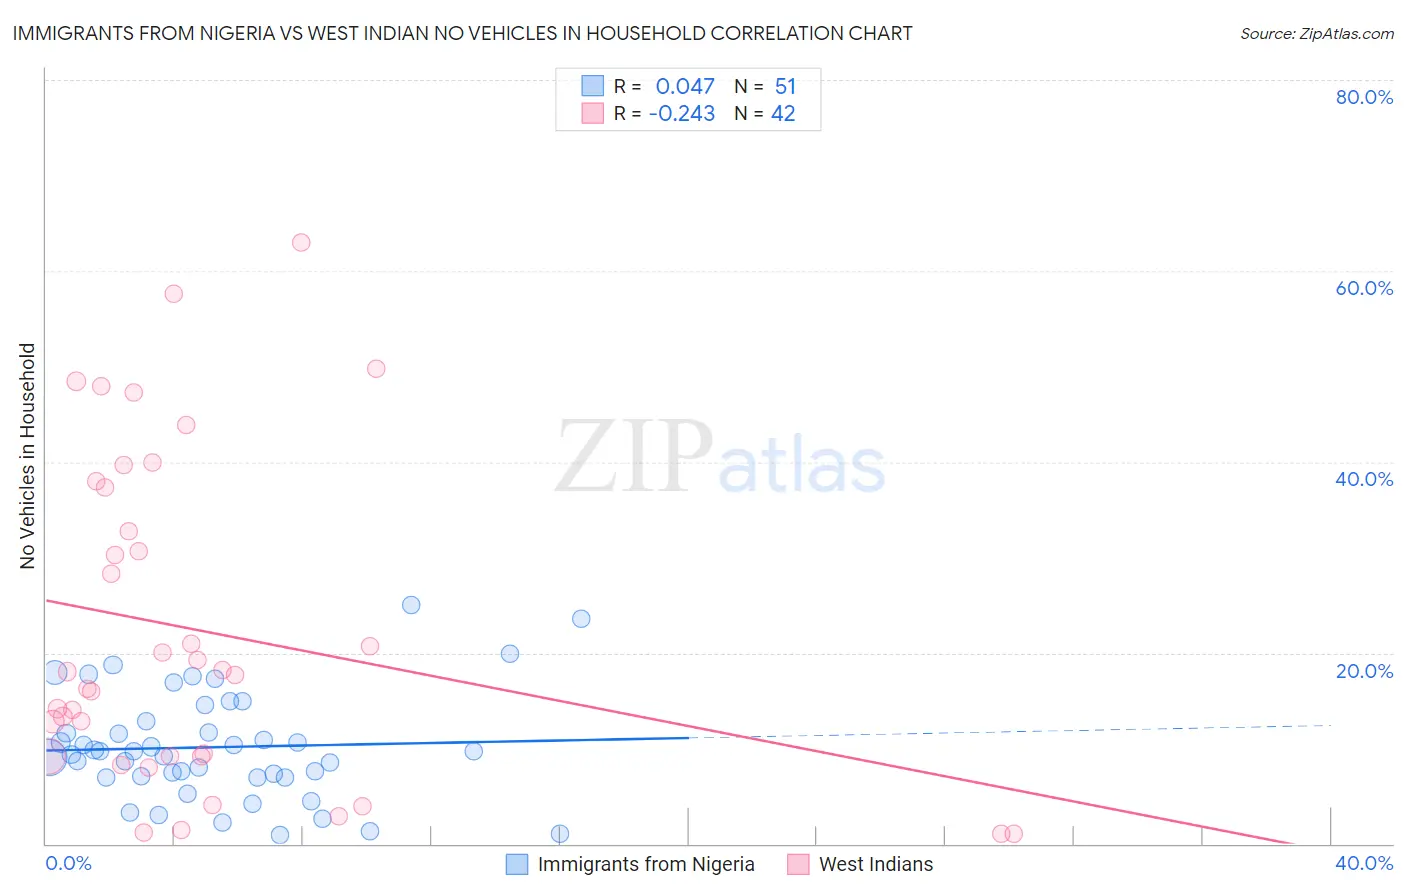
Immigrants from Nigeria vs West Indian No Vehicles in Household Correlation Chart
The statistical analysis conducted on geographies consisting of 283,041,250 people shows no correlation between the proportion of Immigrants from Nigeria and percentage of households with no vehicle available in the United States with a correlation coefficient (R) of 0.047 and weighted average of 11.8%. Similarly, the statistical analysis conducted on geographies consisting of 253,703,061 people shows a weak negative correlation between the proportion of West Indians and percentage of households with no vehicle available in the United States with a correlation coefficient (R) of -0.243 and weighted average of 23.7%, a difference of 101.1%.
No Vehicles in Household Correlation Summary
| Measurement | Immigrants from Nigeria | West Indian |
| Minimum | 0.97% | 1.0% |
| Maximum | 25.0% | 63.0% |
| Range | 24.0% | 62.0% |
| Mean | 10.1% | 22.3% |
| Median | 9.6% | 17.9% |
| Interquartile 25% (IQ1) | 7.0% | 9.2% |
| Interquartile 75% (IQ3) | 12.8% | 37.3% |
| Interquartile Range (IQR) | 5.8% | 28.1% |
| Standard Deviation (Sample) | 5.6% | 17.0% |
| Standard Deviation (Population) | 5.5% | 16.8% |
Similar Demographics by No Vehicles in Household
Demographics Similar to Immigrants from Nigeria by No Vehicles in Household
In terms of no vehicles in household, the demographic groups most similar to Immigrants from Nigeria are Immigrants from Belgium (11.8%, a difference of 0.030%), Immigrants from Czechoslovakia (11.8%, a difference of 0.040%), Menominee (11.8%, a difference of 0.10%), Paiute (11.8%, a difference of 0.22%), and Immigrants from Honduras (11.8%, a difference of 0.26%).
| Demographics | Rating | Rank | No Vehicles in Household |
| Turks | 2.6 /100 | #242 | Tragic 11.7% |
| Cheyenne | 2.4 /100 | #243 | Tragic 11.7% |
| Immigrants | Portugal | 2.2 /100 | #244 | Tragic 11.7% |
| Immigrants | Honduras | 2.1 /100 | #245 | Tragic 11.8% |
| Menominee | 2.0 /100 | #246 | Tragic 11.8% |
| Immigrants | Czechoslovakia | 2.0 /100 | #247 | Tragic 11.8% |
| Immigrants | Belgium | 1.9 /100 | #248 | Tragic 11.8% |
| Immigrants | Nigeria | 1.9 /100 | #249 | Tragic 11.8% |
| Paiute | 1.8 /100 | #250 | Tragic 11.8% |
| Blacks/African Americans | 1.6 /100 | #251 | Tragic 11.9% |
| Immigrants | Serbia | 1.5 /100 | #252 | Tragic 11.9% |
| Egyptians | 1.4 /100 | #253 | Tragic 11.9% |
| Immigrants | Uruguay | 1.3 /100 | #254 | Tragic 11.9% |
| Hondurans | 1.2 /100 | #255 | Tragic 12.0% |
| Liberians | 1.2 /100 | #256 | Tragic 12.0% |
Demographics Similar to West Indians by No Vehicles in Household
In terms of no vehicles in household, the demographic groups most similar to West Indians are Trinidadian and Tobagonian (23.7%, a difference of 0.18%), Immigrants from Ecuador (23.8%, a difference of 0.51%), Immigrants from Trinidad and Tobago (24.6%, a difference of 3.9%), Ecuadorian (22.8%, a difference of 4.2%), and Immigrants from Dominica (22.2%, a difference of 6.6%).
| Demographics | Rating | Rank | No Vehicles in Household |
| Immigrants | Yemen | 0.0 /100 | #323 | Tragic 19.5% |
| Immigrants | Caribbean | 0.0 /100 | #324 | Tragic 19.6% |
| Senegalese | 0.0 /100 | #325 | Tragic 19.8% |
| Immigrants | West Indies | 0.0 /100 | #326 | Tragic 20.5% |
| Immigrants | Senegal | 0.0 /100 | #327 | Tragic 21.1% |
| Immigrants | Dominica | 0.0 /100 | #328 | Tragic 22.2% |
| Ecuadorians | 0.0 /100 | #329 | Tragic 22.8% |
| West Indians | 0.0 /100 | #330 | Tragic 23.7% |
| Trinidadians and Tobagonians | 0.0 /100 | #331 | Tragic 23.7% |
| Immigrants | Ecuador | 0.0 /100 | #332 | Tragic 23.8% |
| Immigrants | Trinidad and Tobago | 0.0 /100 | #333 | Tragic 24.6% |
| Immigrants | Bangladesh | 0.0 /100 | #334 | Tragic 25.8% |
| Barbadians | 0.0 /100 | #335 | Tragic 26.1% |
| Vietnamese | 0.0 /100 | #336 | Tragic 26.2% |
| Immigrants | Uzbekistan | 0.0 /100 | #337 | Tragic 26.7% |