Immigrants from Guatemala vs Ukrainian No Vehicles in Household
COMPARE
Immigrants from Guatemala
Ukrainian
No Vehicles in Household
No Vehicles in Household Comparison
Immigrants from Guatemala
Ukrainians
11.2%
NO VEHICLES IN HOUSEHOLD
10.0/ 100
METRIC RATING
218th/ 347
METRIC RANK
10.7%
NO VEHICLES IN HOUSEHOLD
28.0/ 100
METRIC RATING
193rd/ 347
METRIC RANK
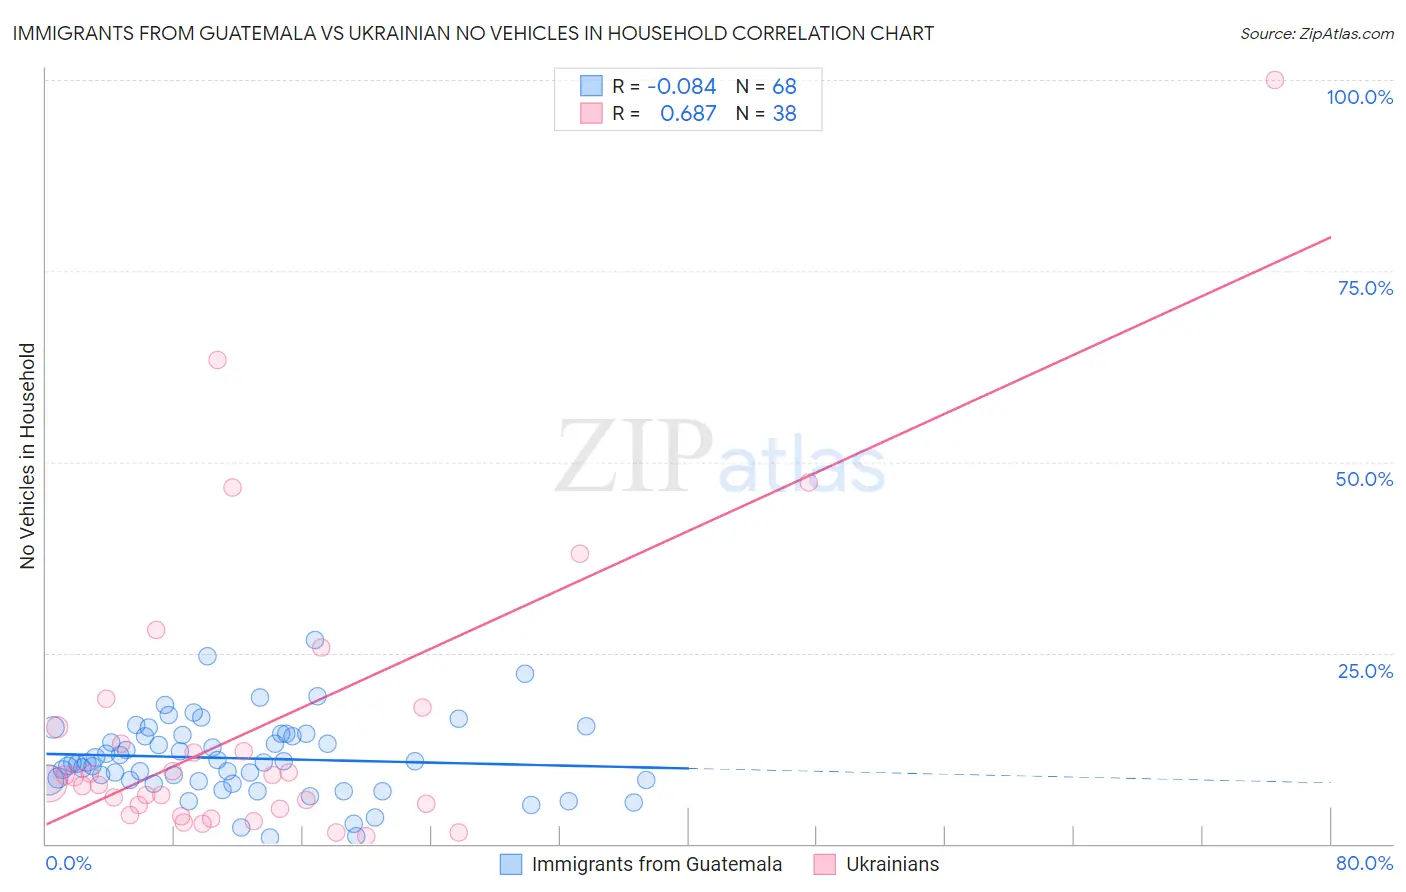
Immigrants from Guatemala vs Ukrainian No Vehicles in Household Correlation Chart
The statistical analysis conducted on geographies consisting of 376,643,696 people shows a slight negative correlation between the proportion of Immigrants from Guatemala and percentage of households with no vehicle available in the United States with a correlation coefficient (R) of -0.084 and weighted average of 11.2%. Similarly, the statistical analysis conducted on geographies consisting of 446,891,229 people shows a significant positive correlation between the proportion of Ukrainians and percentage of households with no vehicle available in the United States with a correlation coefficient (R) of 0.687 and weighted average of 10.7%, a difference of 4.1%.
No Vehicles in Household Correlation Summary
| Measurement | Immigrants from Guatemala | Ukrainian |
| Minimum | 0.74% | 1.0% |
| Maximum | 26.6% | 100.0% |
| Range | 25.9% | 99.0% |
| Mean | 11.2% | 15.2% |
| Median | 10.7% | 8.3% |
| Interquartile 25% (IQ1) | 8.2% | 4.6% |
| Interquartile 75% (IQ3) | 14.3% | 15.2% |
| Interquartile Range (IQR) | 6.1% | 10.7% |
| Standard Deviation (Sample) | 5.1% | 20.0% |
| Standard Deviation (Population) | 5.1% | 19.8% |
Similar Demographics by No Vehicles in Household
Demographics Similar to Immigrants from Guatemala by No Vehicles in Household
In terms of no vehicles in household, the demographic groups most similar to Immigrants from Guatemala are Dutch West Indian (11.2%, a difference of 0.10%), Argentinean (11.2%, a difference of 0.12%), Immigrants from Zaire (11.2%, a difference of 0.14%), Immigrants from Argentina (11.2%, a difference of 0.22%), and Immigrants from Sri Lanka (11.2%, a difference of 0.23%).
| Demographics | Rating | Rank | No Vehicles in Household |
| Crow | 14.2 /100 | #211 | Poor 11.0% |
| Immigrants | Western Asia | 13.9 /100 | #212 | Poor 11.0% |
| Immigrants | Hungary | 12.3 /100 | #213 | Poor 11.1% |
| Immigrants | Denmark | 12.1 /100 | #214 | Poor 11.1% |
| Immigrants | Sri Lanka | 10.6 /100 | #215 | Poor 11.2% |
| Immigrants | Argentina | 10.6 /100 | #216 | Poor 11.2% |
| Dutch West Indians | 10.2 /100 | #217 | Poor 11.2% |
| Immigrants | Guatemala | 10.0 /100 | #218 | Tragic 11.2% |
| Argentineans | 9.6 /100 | #219 | Tragic 11.2% |
| Immigrants | Zaire | 9.6 /100 | #220 | Tragic 11.2% |
| Peruvians | 8.4 /100 | #221 | Tragic 11.2% |
| Immigrants | South America | 8.0 /100 | #222 | Tragic 11.3% |
| Uruguayans | 7.7 /100 | #223 | Tragic 11.3% |
| Immigrants | Hong Kong | 7.2 /100 | #224 | Tragic 11.3% |
| Immigrants | Sierra Leone | 6.4 /100 | #225 | Tragic 11.3% |
Demographics Similar to Ukrainians by No Vehicles in Household
In terms of no vehicles in household, the demographic groups most similar to Ukrainians are Pueblo (10.8%, a difference of 0.17%), Immigrants from Brazil (10.8%, a difference of 0.29%), Central American (10.8%, a difference of 0.63%), Carpatho Rusyn (10.7%, a difference of 0.64%), and Shoshone (10.8%, a difference of 0.67%).
| Demographics | Rating | Rank | No Vehicles in Household |
| German Russians | 40.6 /100 | #186 | Average 10.5% |
| Immigrants | Poland | 38.4 /100 | #187 | Fair 10.6% |
| Immigrants | Armenia | 37.5 /100 | #188 | Fair 10.6% |
| Immigrants | Eritrea | 36.3 /100 | #189 | Fair 10.6% |
| Immigrants | North Macedonia | 34.6 /100 | #190 | Fair 10.6% |
| Immigrants | Northern Europe | 33.1 /100 | #191 | Fair 10.7% |
| Carpatho Rusyns | 32.1 /100 | #192 | Fair 10.7% |
| Ukrainians | 28.0 /100 | #193 | Fair 10.7% |
| Pueblo | 27.0 /100 | #194 | Fair 10.8% |
| Immigrants | Brazil | 26.3 /100 | #195 | Fair 10.8% |
| Central Americans | 24.3 /100 | #196 | Fair 10.8% |
| Shoshone | 24.1 /100 | #197 | Fair 10.8% |
| Immigrants | Sweden | 22.9 /100 | #198 | Fair 10.8% |
| Immigrants | Asia | 21.3 /100 | #199 | Fair 10.9% |
| Cambodians | 19.6 /100 | #200 | Poor 10.9% |