Hungarian vs Ukrainian No Vehicles in Household
COMPARE
Hungarian
Ukrainian
No Vehicles in Household
No Vehicles in Household Comparison
Hungarians
Ukrainians
9.9%
NO VEHICLES IN HOUSEHOLD
80.0/ 100
METRIC RATING
146th/ 347
METRIC RANK
10.7%
NO VEHICLES IN HOUSEHOLD
28.0/ 100
METRIC RATING
193rd/ 347
METRIC RANK
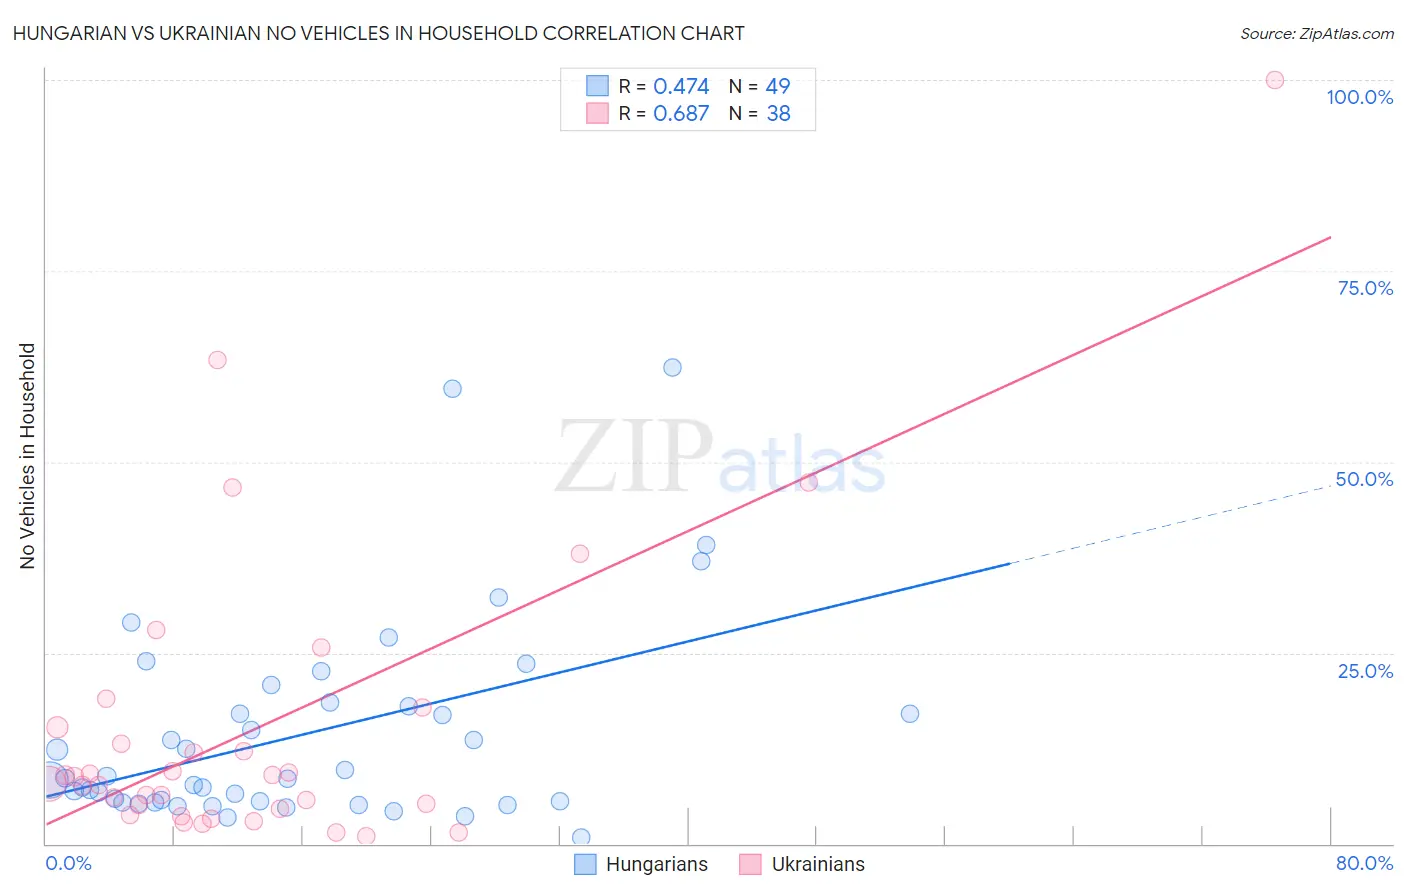
Hungarian vs Ukrainian No Vehicles in Household Correlation Chart
The statistical analysis conducted on geographies consisting of 483,786,573 people shows a moderate positive correlation between the proportion of Hungarians and percentage of households with no vehicle available in the United States with a correlation coefficient (R) of 0.474 and weighted average of 9.9%. Similarly, the statistical analysis conducted on geographies consisting of 446,891,229 people shows a significant positive correlation between the proportion of Ukrainians and percentage of households with no vehicle available in the United States with a correlation coefficient (R) of 0.687 and weighted average of 10.7%, a difference of 8.3%.
No Vehicles in Household Correlation Summary
| Measurement | Hungarian | Ukrainian |
| Minimum | 0.88% | 1.0% |
| Maximum | 62.3% | 100.0% |
| Range | 61.5% | 99.0% |
| Mean | 14.3% | 15.2% |
| Median | 8.5% | 8.3% |
| Interquartile 25% (IQ1) | 5.5% | 4.6% |
| Interquartile 75% (IQ3) | 18.2% | 15.2% |
| Interquartile Range (IQR) | 12.8% | 10.7% |
| Standard Deviation (Sample) | 13.4% | 20.0% |
| Standard Deviation (Population) | 13.2% | 19.8% |
Similar Demographics by No Vehicles in Household
Demographics Similar to Hungarians by No Vehicles in Household
In terms of no vehicles in household, the demographic groups most similar to Hungarians are Immigrants from Nicaragua (9.9%, a difference of 0.060%), Immigrants from Bosnia and Herzegovina (9.9%, a difference of 0.20%), Bahamian (9.9%, a difference of 0.23%), Chilean (9.9%, a difference of 0.26%), and Immigrants from Bahamas (9.9%, a difference of 0.26%).
| Demographics | Rating | Rank | No Vehicles in Household |
| Marshallese | 84.0 /100 | #139 | Excellent 9.8% |
| Immigrants | Lithuania | 84.0 /100 | #140 | Excellent 9.8% |
| Sudanese | 83.1 /100 | #141 | Excellent 9.8% |
| Immigrants | Zimbabwe | 82.6 /100 | #142 | Excellent 9.9% |
| Chileans | 81.2 /100 | #143 | Excellent 9.9% |
| Immigrants | Bahamas | 81.2 /100 | #144 | Excellent 9.9% |
| Bahamians | 81.0 /100 | #145 | Excellent 9.9% |
| Hungarians | 80.0 /100 | #146 | Excellent 9.9% |
| Immigrants | Nicaragua | 79.8 /100 | #147 | Good 9.9% |
| Immigrants | Bosnia and Herzegovina | 79.1 /100 | #148 | Good 9.9% |
| Immigrants | Uganda | 76.1 /100 | #149 | Good 10.0% |
| Colombians | 73.9 /100 | #150 | Good 10.0% |
| Immigrants | Eastern Africa | 73.8 /100 | #151 | Good 10.0% |
| Immigrants | Congo | 73.0 /100 | #152 | Good 10.1% |
| Tlingit-Haida | 72.5 /100 | #153 | Good 10.1% |
Demographics Similar to Ukrainians by No Vehicles in Household
In terms of no vehicles in household, the demographic groups most similar to Ukrainians are Pueblo (10.8%, a difference of 0.17%), Immigrants from Brazil (10.8%, a difference of 0.29%), Central American (10.8%, a difference of 0.63%), Carpatho Rusyn (10.7%, a difference of 0.64%), and Shoshone (10.8%, a difference of 0.67%).
| Demographics | Rating | Rank | No Vehicles in Household |
| German Russians | 40.6 /100 | #186 | Average 10.5% |
| Immigrants | Poland | 38.4 /100 | #187 | Fair 10.6% |
| Immigrants | Armenia | 37.5 /100 | #188 | Fair 10.6% |
| Immigrants | Eritrea | 36.3 /100 | #189 | Fair 10.6% |
| Immigrants | North Macedonia | 34.6 /100 | #190 | Fair 10.6% |
| Immigrants | Northern Europe | 33.1 /100 | #191 | Fair 10.7% |
| Carpatho Rusyns | 32.1 /100 | #192 | Fair 10.7% |
| Ukrainians | 28.0 /100 | #193 | Fair 10.7% |
| Pueblo | 27.0 /100 | #194 | Fair 10.8% |
| Immigrants | Brazil | 26.3 /100 | #195 | Fair 10.8% |
| Central Americans | 24.3 /100 | #196 | Fair 10.8% |
| Shoshone | 24.1 /100 | #197 | Fair 10.8% |
| Immigrants | Sweden | 22.9 /100 | #198 | Fair 10.8% |
| Immigrants | Asia | 21.3 /100 | #199 | Fair 10.9% |
| Cambodians | 19.6 /100 | #200 | Poor 10.9% |