Immigrants from Hungary vs Ukrainian No Vehicles in Household

COMPARE

Immigrants from Hungary
Race
Ancestry
AfghanAfricanAlaska NativeAlaskan AthabascanAlbanianAleutAlsatianAmericanApacheArabArapahoArgentineanArmenianAssyrian/Chaldean/SyriacAustralianAustrianBahamianBangladeshiBarbadianBasqueBelgianBelizeanBermudanBhutaneseBlackfeetBolivianBrazilianBritishBritish West IndianBulgarianBurmeseCajunCambodianCanadianCape VerdeanCarpatho RusynCelticCentral AmericanCentral American IndianCherokeeCheyenneChickasawChileanChineseChippewaChoctawColombianColvilleComancheCosta RicanCreeCreekCroatianCrowCubanCypriotCzechCzechoslovakianDanishDelawareDominicanDutchDutch West IndianEastern EuropeanEcuadorianEgyptianEnglishEstonianEthiopianEuropeanFijianFilipinoFinnishFrenchFrench American IndianFrench CanadianGermanGerman RussianGhanaianGreekGuamanian/ChamorroGuatemalanGuyaneseHaitianHmongHonduranHopiHoumaHungarianIcelanderIndian (Asian)IndonesianInupiatIranianIraqiIrishIroquoisIsraeliItalianJamaicanJapaneseJordanianKenyanKiowaKoreanLaotianLatvianLebaneseLiberianLithuanianLumbeeLuxembourgerMacedonianMalaysianMalteseMarshalleseMenomineeMexicanMexican American IndianMongolianMoroccanNative HawaiianNavajoNepaleseNew ZealanderNicaraguanNigerianNorthern EuropeanNorwegianOkinawanOsageOttawaPaiutePakistaniPalestinianPanamanianParaguayanPennsylvania GermanPeruvianPimaPolishPortuguesePotawatomiPuebloPuerto RicanPuget Sound SalishRomanianRussianSalvadoranSamoanScandinavianScotch-IrishScottishSeminoleSenegaleseSerbianShoshoneSierra LeoneanSiouxSlavicSlovakSloveneSomaliSouth AfricanSouth AmericanSouth American IndianSoviet UnionSpaniardSpanishSpanish AmericanSpanish American IndianSri LankanSubsaharan AfricanSudaneseSwedishSwissSyrianTaiwaneseThaiTlingit-HaidaTohono O'OdhamTonganTrinidadian and TobagonianTsimshianTurkishU.S. Virgin IslanderUgandanUruguayanUteVenezuelanVietnameseWelshWest IndianYakamaYaquiYugoslavianYumanYup'ikZimbabwean
Immigration
NonimmigrantsImmigrantsAfghanistanAfricaAlbaniaArgentinaArmeniaAsiaAustraliaAustriaBahamasBangladeshBarbadosBelarusBelgiumBelizeBoliviaBosnia and HerzegovinaBrazilBulgariaBurma/MyanmarCabo VerdeCambodiaCameroonCanadaCaribbeanCentral AmericaChileChinaColombiaCongoCosta RicaCroatiaCubaCzechoslovakiaDenmarkDominicaDominican RepublicEastern AfricaEastern AsiaEastern EuropeEcuadorEgyptEl SalvadorEnglandEritreaEthiopiaEuropeFijiFranceGermanyGhanaGreeceGrenadaGuatemalaGuyanaHaitiHondurasHong KongHungaryIndiaIndonesiaIranIraqIrelandIsraelItalyJamaicaJapanJordanKazakhstanKenyaKoreaKuwaitLaosLatin AmericaLatviaLebanonLiberiaLithuaniaMalaysiaMexicoMicronesiaMiddle AfricaMoldovaMoroccoNepalNetherlandsNicaraguaNigeriaNorth AmericaNorth MacedoniaNorthern AfricaNorthern EuropeNorwayOceaniaPakistanPanamaPeruPhilippinesPolandPortugalRomaniaRussiaSaudi ArabiaScotlandSenegalSerbiaSierra LeoneSingaporeSomaliaSouth AfricaSouth AmericaSouth Central AsiaSouth Eastern AsiaSouthern EuropeSpainSri LankaSt. Vincent and the GrenadinesSudanSwedenSwitzerlandSyriaTaiwanThailandTrinidad and TobagoTurkeyUgandaUkraineUruguayUzbekistanVenezuelaVietnamWest IndiesWestern AfricaWestern AsiaWestern EuropeYemenZaireZimbabweAzores
Ukrainian
Race
Ancestry
AfghanAfricanAlaska NativeAlaskan AthabascanAlbanianAleutAlsatianAmericanApacheArabArapahoArgentineanArmenianAssyrian/Chaldean/SyriacAustralianAustrianBahamianBangladeshiBarbadianBasqueBelgianBelizeanBermudanBhutaneseBlackfeetBolivianBrazilianBritishBritish West IndianBulgarianBurmeseCajunCambodianCanadianCape VerdeanCarpatho RusynCelticCentral AmericanCentral American IndianCherokeeCheyenneChickasawChileanChineseChippewaChoctawColombianColvilleComancheCosta RicanCreeCreekCroatianCrowCubanCypriotCzechCzechoslovakianDanishDelawareDominicanDutchDutch West IndianEastern EuropeanEcuadorianEgyptianEnglishEstonianEthiopianEuropeanFijianFilipinoFinnishFrenchFrench American IndianFrench CanadianGermanGerman RussianGhanaianGreekGuamanian/ChamorroGuatemalanGuyaneseHaitianHmongHonduranHopiHoumaHungarianIcelanderIndian (Asian)IndonesianInupiatIranianIraqiIrishIroquoisIsraeliItalianJamaicanJapaneseJordanianKenyanKiowaKoreanLaotianLatvianLebaneseLiberianLithuanianLumbeeLuxembourgerMacedonianMalaysianMalteseMarshalleseMenomineeMexicanMexican American IndianMongolianMoroccanNative HawaiianNavajoNepaleseNew ZealanderNicaraguanNigerianNorthern EuropeanNorwegianOkinawanOsageOttawaPaiutePakistaniPalestinianPanamanianParaguayanPennsylvania GermanPeruvianPimaPolishPortuguesePotawatomiPuebloPuerto RicanPuget Sound SalishRomanianRussianSalvadoranSamoanScandinavianScotch-IrishScottishSeminoleSenegaleseSerbianShoshoneSierra LeoneanSiouxSlavicSlovakSloveneSomaliSouth AfricanSouth AmericanSouth American IndianSoviet UnionSpaniardSpanishSpanish AmericanSpanish American IndianSri LankanSubsaharan AfricanSudaneseSwedishSwissSyrianTaiwaneseThaiTlingit-HaidaTohono O'OdhamTonganTrinidadian and TobagonianTsimshianTurkishU.S. Virgin IslanderUgandanUkrainianUruguayanUteVenezuelanVietnameseWelshWest IndianYakamaYaquiYugoslavianYumanYup'ikZimbabwean
Immigration
NonimmigrantsImmigrantsAfghanistanAfricaAlbaniaArgentinaArmeniaAsiaAustraliaAustriaBahamasBangladeshBarbadosBelarusBelgiumBelizeBoliviaBosnia and HerzegovinaBrazilBulgariaBurma/MyanmarCabo VerdeCambodiaCameroonCanadaCaribbeanCentral AmericaChileChinaColombiaCongoCosta RicaCroatiaCubaCzechoslovakiaDenmarkDominicaDominican RepublicEastern AfricaEastern AsiaEastern EuropeEcuadorEgyptEl SalvadorEnglandEritreaEthiopiaEuropeFijiFranceGermanyGhanaGreeceGrenadaGuatemalaGuyanaHaitiHondurasHong KongIndiaIndonesiaIranIraqIrelandIsraelItalyJamaicaJapanJordanKazakhstanKenyaKoreaKuwaitLaosLatin AmericaLatviaLebanonLiberiaLithuaniaMalaysiaMexicoMicronesiaMiddle AfricaMoldovaMoroccoNepalNetherlandsNicaraguaNigeriaNorth AmericaNorth MacedoniaNorthern AfricaNorthern EuropeNorwayOceaniaPakistanPanamaPeruPhilippinesPolandPortugalRomaniaRussiaSaudi ArabiaScotlandSenegalSerbiaSierra LeoneSingaporeSomaliaSouth AfricaSouth AmericaSouth Central AsiaSouth Eastern AsiaSouthern EuropeSpainSri LankaSt. Vincent and the GrenadinesSudanSwedenSwitzerlandSyriaTaiwanThailandTrinidad and TobagoTurkeyUgandaUkraineUruguayUzbekistanVenezuelaVietnamWest IndiesWestern AfricaWestern AsiaWestern EuropeYemenZaireZimbabweAzores
No Vehicles in Household
Income
Poverty
Unemployment
Labor Participation
Family Structure
Vehicle Availability
Education Level
Disability

No Vehicles in Household Comparison

Immigrants from Hungary

Ukrainians

Poor
Fair
11.1%
NO VEHICLES IN HOUSEHOLD
12.3/ 100
METRIC RATING
213th/ 347
METRIC RANK
10.7%
NO VEHICLES IN HOUSEHOLD
28.0/ 100
METRIC RATING
193rd/ 347
METRIC RANK

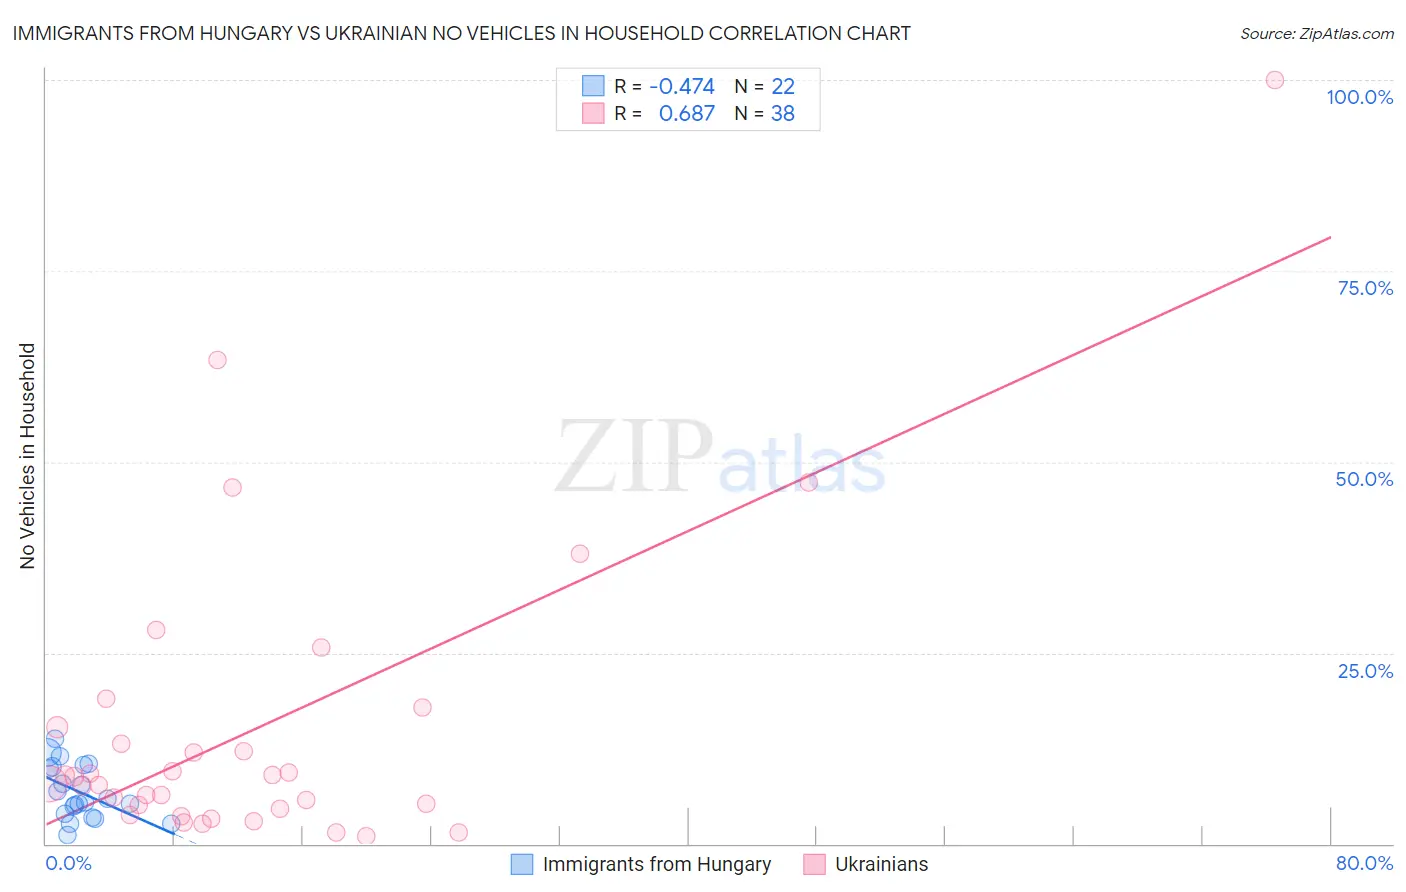
Immigrants from Hungary vs Ukrainian No Vehicles in Household Correlation Chart

The statistical analysis conducted on geographies consisting of 195,539,885 people shows a moderate negative correlation between the proportion of Immigrants from Hungary and percentage of households with no vehicle available in the United States with a correlation coefficient (R) of -0.474 and weighted average of 11.1%. Similarly, the statistical analysis conducted on geographies consisting of 446,891,229 people shows a significant positive correlation between the proportion of Ukrainians and percentage of households with no vehicle available in the United States with a correlation coefficient (R) of 0.687 and weighted average of 10.7%, a difference of 3.3%.
Immigrants from Hungary vs Ukrainian No Vehicles in Household

No Vehicles in Household Correlation Summary

MeasurementImmigrants from HungaryUkrainian
Minimum1.1%1.0%
Maximum13.8%100.0%
Range12.7%99.0%
Mean6.8%15.2%
Median5.7%8.3%
Interquartile 25% (IQ1)4.0%4.6%
Interquartile 75% (IQ3)10.1%15.2%
Interquartile Range (IQR)6.1%10.7%
Standard Deviation (Sample)3.5%20.0%
Standard Deviation (Population)3.4%19.8%

Demographics Similar to Immigrants from Hungary and Ukrainians by No Vehicles in Household

In terms of no vehicles in household, the demographic groups most similar to Immigrants from Hungary are Immigrants from Western Asia (11.0%, a difference of 0.43%), Crow (11.0%, a difference of 0.52%), Apache (11.0%, a difference of 0.69%), Pennsylvania German (11.0%, a difference of 0.85%), and Immigrants from Italy (11.0%, a difference of 0.88%). Similarly, the demographic groups most similar to Ukrainians are Pueblo (10.8%, a difference of 0.17%), Immigrants from Brazil (10.8%, a difference of 0.29%), Central American (10.8%, a difference of 0.63%), Shoshone (10.8%, a difference of 0.67%), and Immigrants from Sweden (10.8%, a difference of 0.88%).
DemographicsRating | RankNo Vehicles in Household
Ukrainians
28.0
/100
|
#193
Fair
10.7%
Pueblo
27.0
/100
|
#194
Fair
10.8%
Immigrants | Brazil
26.3
/100
|
#195
Fair
10.8%
Central Americans
24.3
/100
|
#196
Fair
10.8%
Shoshone
24.1
/100
|
#197
Fair
10.8%
Immigrants | Sweden
22.9
/100
|
#198
Fair
10.8%
Immigrants | Asia
21.3
/100
|
#199
Fair
10.9%
Cambodians
19.6
/100
|
#200
Poor
10.9%
Immigrants | Western Europe
19.1
/100
|
#201
Poor
10.9%
Romanians
17.9
/100
|
#202
Poor
10.9%
Iroquois
17.6
/100
|
#203
Poor
10.9%
Guatemalans
16.1
/100
|
#204
Poor
11.0%
Immigrants | Chile
15.9
/100
|
#205
Poor
11.0%
Somalis
15.9
/100
|
#206
Poor
11.0%
Sierra Leoneans
15.7
/100
|
#207
Poor
11.0%
Immigrants | Italy
15.6
/100
|
#208
Poor
11.0%
Pennsylvania Germans
15.5
/100
|
#209
Poor
11.0%
Apache
14.8
/100
|
#210
Poor
11.0%
Crow
14.2
/100
|
#211
Poor
11.0%
Immigrants | Western Asia
13.9
/100
|
#212
Poor
11.0%
Immigrants | Hungary
12.3
/100
|
#213
Poor
11.1%