Cypriot vs South African 2 or more Vehicles in Household
COMPARE
Cypriot
South African
2 or more Vehicles in Household
2 or more Vehicles in Household Comparison
Cypriots
South Africans
50.6%
2 OR MORE VEHICLES IN HOUSEHOLD
0.0/ 100
METRIC RATING
295th/ 347
METRIC RANK
56.2%
2 OR MORE VEHICLES IN HOUSEHOLD
83.1/ 100
METRIC RATING
142nd/ 347
METRIC RANK
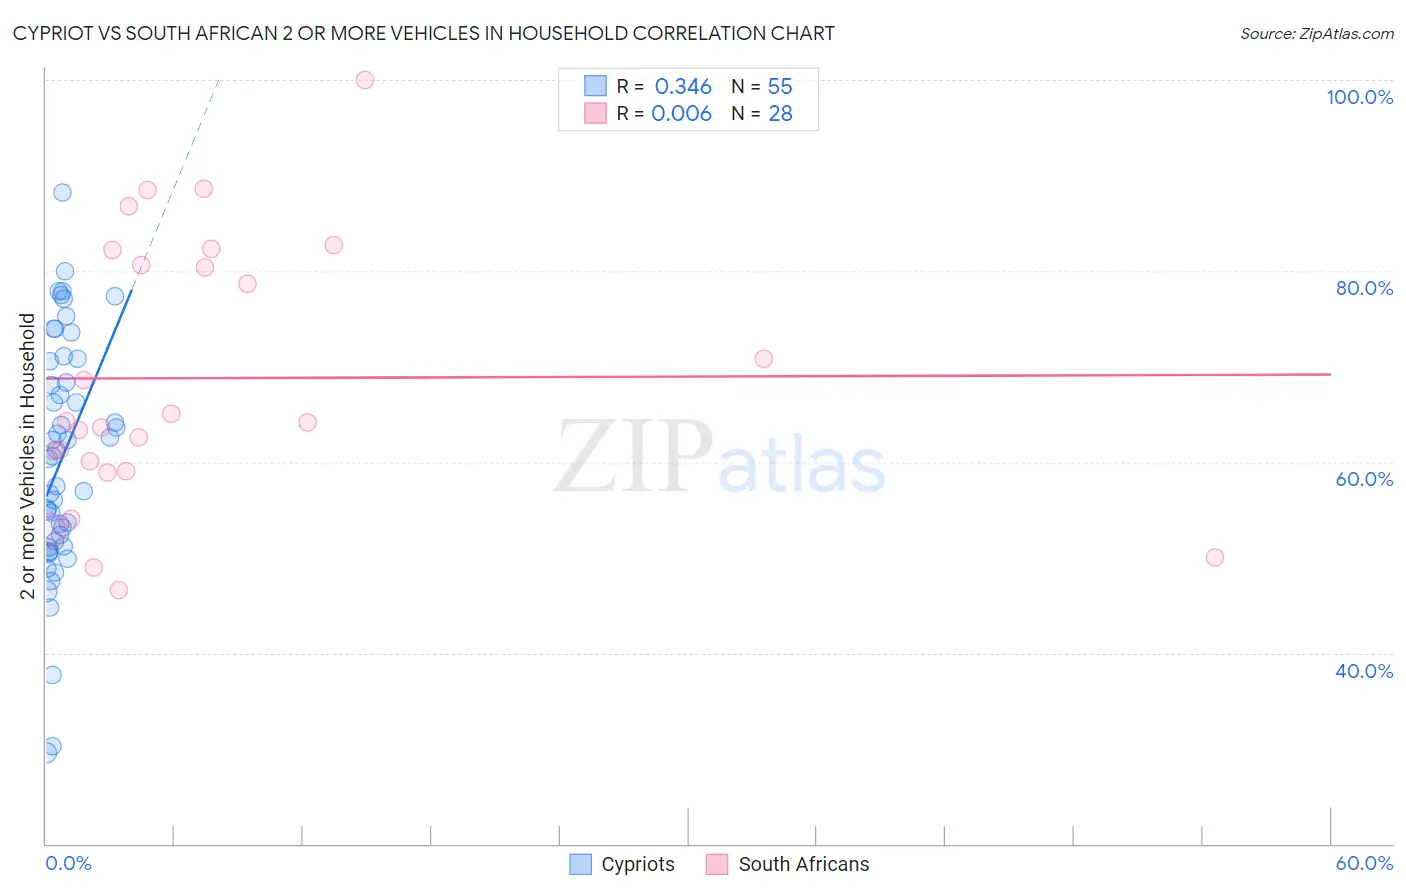
Cypriot vs South African 2 or more Vehicles in Household Correlation Chart
The statistical analysis conducted on geographies consisting of 61,854,678 people shows a mild positive correlation between the proportion of Cypriots and percentage of households with 2 or more vehicles available in the United States with a correlation coefficient (R) of 0.346 and weighted average of 50.6%. Similarly, the statistical analysis conducted on geographies consisting of 182,559,953 people shows no correlation between the proportion of South Africans and percentage of households with 2 or more vehicles available in the United States with a correlation coefficient (R) of 0.006 and weighted average of 56.2%, a difference of 11.2%.
2 or more Vehicles in Household Correlation Summary
| Measurement | Cypriot | South African |
| Minimum | 29.5% | 46.6% |
| Maximum | 88.3% | 100.0% |
| Range | 58.8% | 53.4% |
| Mean | 60.3% | 68.8% |
| Median | 60.5% | 64.2% |
| Interquartile 25% (IQ1) | 51.1% | 59.5% |
| Interquartile 75% (IQ3) | 70.5% | 81.4% |
| Interquartile Range (IQR) | 19.4% | 21.9% |
| Standard Deviation (Sample) | 12.4% | 14.0% |
| Standard Deviation (Population) | 12.3% | 13.7% |
Similar Demographics by 2 or more Vehicles in Household
Demographics Similar to Cypriots by 2 or more Vehicles in Household
In terms of 2 or more vehicles in household, the demographic groups most similar to Cypriots are Immigrants from Somalia (50.5%, a difference of 0.040%), Bermudan (50.6%, a difference of 0.070%), Immigrants from Spain (50.4%, a difference of 0.31%), Paraguayan (50.3%, a difference of 0.44%), and Immigrants from Morocco (50.3%, a difference of 0.47%).
| Demographics | Rating | Rank | 2 or more Vehicles in Household |
| Okinawans | 0.1 /100 | #288 | Tragic 51.2% |
| Somalis | 0.0 /100 | #289 | Tragic 51.1% |
| Immigrants | Panama | 0.0 /100 | #290 | Tragic 51.1% |
| Belizeans | 0.0 /100 | #291 | Tragic 51.0% |
| Immigrants | Ukraine | 0.0 /100 | #292 | Tragic 50.9% |
| Blacks/African Americans | 0.0 /100 | #293 | Tragic 50.9% |
| Bermudans | 0.0 /100 | #294 | Tragic 50.6% |
| Cypriots | 0.0 /100 | #295 | Tragic 50.6% |
| Immigrants | Somalia | 0.0 /100 | #296 | Tragic 50.5% |
| Immigrants | Spain | 0.0 /100 | #297 | Tragic 50.4% |
| Paraguayans | 0.0 /100 | #298 | Tragic 50.3% |
| Immigrants | Morocco | 0.0 /100 | #299 | Tragic 50.3% |
| Immigrants | Russia | 0.0 /100 | #300 | Tragic 50.3% |
| Immigrants | Greece | 0.0 /100 | #301 | Tragic 50.2% |
| Immigrants | South America | 0.0 /100 | #302 | Tragic 50.2% |
Demographics Similar to South Africans by 2 or more Vehicles in Household
In terms of 2 or more vehicles in household, the demographic groups most similar to South Africans are Latvian (56.2%, a difference of 0.040%), Immigrants from Cambodia (56.2%, a difference of 0.040%), Armenian (56.3%, a difference of 0.090%), Seminole (56.2%, a difference of 0.090%), and Immigrants from Syria (56.2%, a difference of 0.11%).
| Demographics | Rating | Rank | 2 or more Vehicles in Household |
| Blackfeet | 86.5 /100 | #135 | Excellent 56.4% |
| Immigrants | Asia | 86.0 /100 | #136 | Excellent 56.3% |
| Cubans | 84.8 /100 | #137 | Excellent 56.3% |
| Salvadorans | 84.7 /100 | #138 | Excellent 56.3% |
| Armenians | 84.3 /100 | #139 | Excellent 56.3% |
| Latvians | 83.6 /100 | #140 | Excellent 56.2% |
| Immigrants | Cambodia | 83.6 /100 | #141 | Excellent 56.2% |
| South Africans | 83.1 /100 | #142 | Excellent 56.2% |
| Seminole | 81.7 /100 | #143 | Excellent 56.2% |
| Immigrants | Syria | 81.4 /100 | #144 | Excellent 56.2% |
| Syrians | 81.2 /100 | #145 | Excellent 56.2% |
| Venezuelans | 80.7 /100 | #146 | Excellent 56.1% |
| Serbians | 80.3 /100 | #147 | Excellent 56.1% |
| Immigrants | Moldova | 80.2 /100 | #148 | Excellent 56.1% |
| Chileans | 80.2 /100 | #149 | Excellent 56.1% |