Jordanian vs South African 2 or more Vehicles in Household
COMPARE
Jordanian
South African
2 or more Vehicles in Household
2 or more Vehicles in Household Comparison
Jordanians
South Africans
57.6%
2 OR MORE VEHICLES IN HOUSEHOLD
98.2/ 100
METRIC RATING
103rd/ 347
METRIC RANK
56.2%
2 OR MORE VEHICLES IN HOUSEHOLD
83.1/ 100
METRIC RATING
142nd/ 347
METRIC RANK
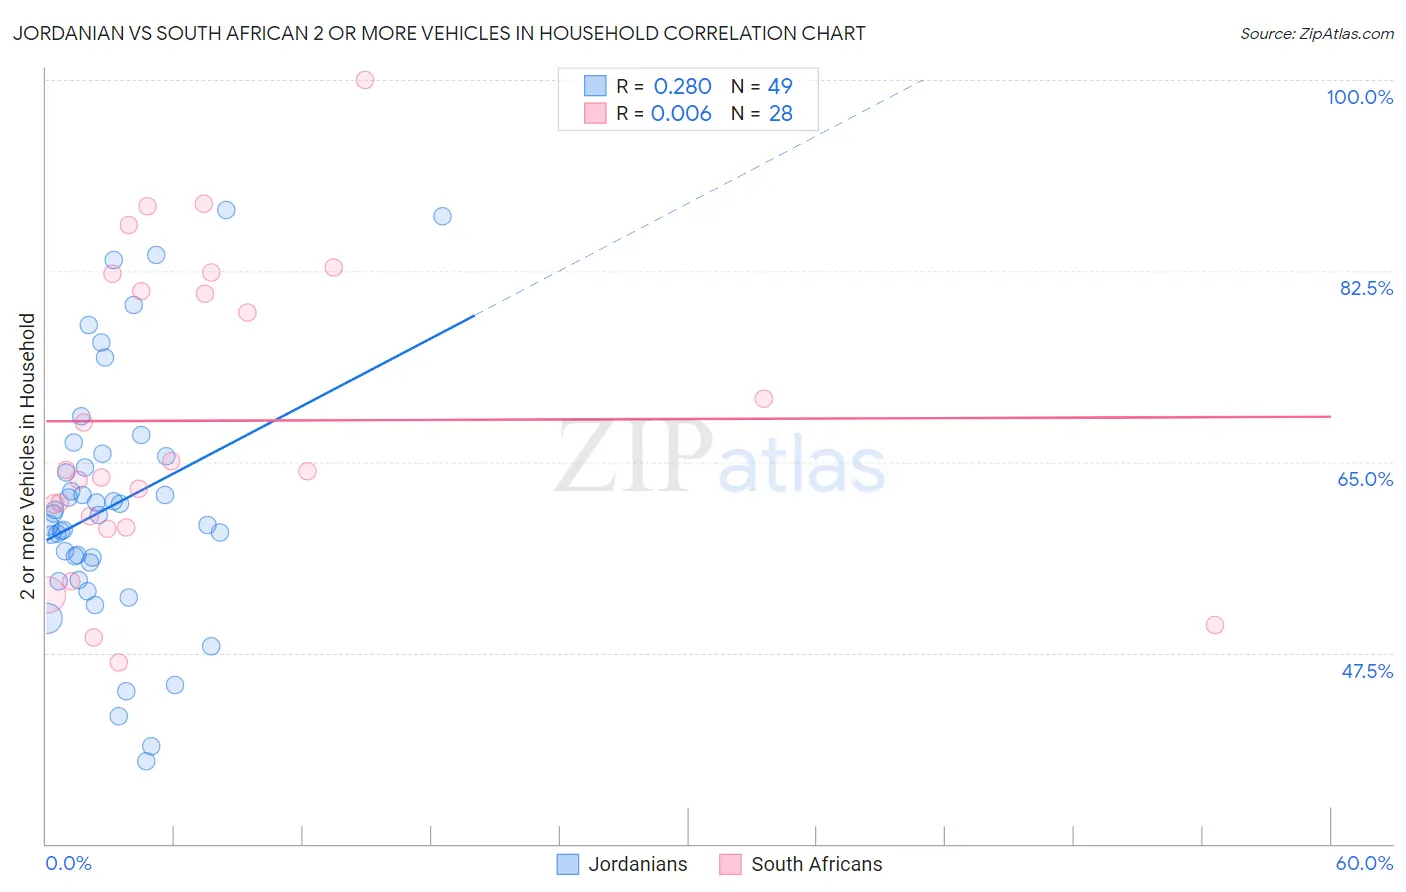
Jordanian vs South African 2 or more Vehicles in Household Correlation Chart
The statistical analysis conducted on geographies consisting of 166,396,176 people shows a weak positive correlation between the proportion of Jordanians and percentage of households with 2 or more vehicles available in the United States with a correlation coefficient (R) of 0.280 and weighted average of 57.6%. Similarly, the statistical analysis conducted on geographies consisting of 182,559,953 people shows no correlation between the proportion of South Africans and percentage of households with 2 or more vehicles available in the United States with a correlation coefficient (R) of 0.006 and weighted average of 56.2%, a difference of 2.4%.
2 or more Vehicles in Household Correlation Summary
| Measurement | Jordanian | South African |
| Minimum | 37.6% | 46.6% |
| Maximum | 88.1% | 100.0% |
| Range | 50.5% | 53.4% |
| Mean | 61.0% | 68.8% |
| Median | 60.1% | 64.2% |
| Interquartile 25% (IQ1) | 55.0% | 59.5% |
| Interquartile 75% (IQ3) | 65.6% | 81.4% |
| Interquartile Range (IQR) | 10.6% | 21.9% |
| Standard Deviation (Sample) | 11.5% | 14.0% |
| Standard Deviation (Population) | 11.4% | 13.7% |
Similar Demographics by 2 or more Vehicles in Household
Demographics Similar to Jordanians by 2 or more Vehicles in Household
In terms of 2 or more vehicles in household, the demographic groups most similar to Jordanians are Immigrants from Bolivia (57.6%, a difference of 0.0%), Immigrants from Indonesia (57.6%, a difference of 0.0%), Immigrants from Korea (57.6%, a difference of 0.010%), Immigrants from Oceania (57.5%, a difference of 0.020%), and Immigrants from Netherlands (57.5%, a difference of 0.040%).
| Demographics | Rating | Rank | 2 or more Vehicles in Household |
| Burmese | 98.8 /100 | #96 | Exceptional 57.8% |
| Slavs | 98.8 /100 | #97 | Exceptional 57.8% |
| Palestinians | 98.6 /100 | #98 | Exceptional 57.7% |
| Cajuns | 98.5 /100 | #99 | Exceptional 57.7% |
| Fijians | 98.4 /100 | #100 | Exceptional 57.6% |
| Lebanese | 98.3 /100 | #101 | Exceptional 57.6% |
| Immigrants | Bolivia | 98.2 /100 | #102 | Exceptional 57.6% |
| Jordanians | 98.2 /100 | #103 | Exceptional 57.6% |
| Immigrants | Indonesia | 98.2 /100 | #104 | Exceptional 57.6% |
| Immigrants | Korea | 98.2 /100 | #105 | Exceptional 57.6% |
| Immigrants | Oceania | 98.2 /100 | #106 | Exceptional 57.5% |
| Immigrants | Netherlands | 98.2 /100 | #107 | Exceptional 57.5% |
| Immigrants | Canada | 98.1 /100 | #108 | Exceptional 57.5% |
| Immigrants | North America | 98.1 /100 | #109 | Exceptional 57.5% |
| Japanese | 98.0 /100 | #110 | Exceptional 57.5% |
Demographics Similar to South Africans by 2 or more Vehicles in Household
In terms of 2 or more vehicles in household, the demographic groups most similar to South Africans are Latvian (56.2%, a difference of 0.040%), Immigrants from Cambodia (56.2%, a difference of 0.040%), Armenian (56.3%, a difference of 0.090%), Seminole (56.2%, a difference of 0.090%), and Immigrants from Syria (56.2%, a difference of 0.11%).
| Demographics | Rating | Rank | 2 or more Vehicles in Household |
| Blackfeet | 86.5 /100 | #135 | Excellent 56.4% |
| Immigrants | Asia | 86.0 /100 | #136 | Excellent 56.3% |
| Cubans | 84.8 /100 | #137 | Excellent 56.3% |
| Salvadorans | 84.7 /100 | #138 | Excellent 56.3% |
| Armenians | 84.3 /100 | #139 | Excellent 56.3% |
| Latvians | 83.6 /100 | #140 | Excellent 56.2% |
| Immigrants | Cambodia | 83.6 /100 | #141 | Excellent 56.2% |
| South Africans | 83.1 /100 | #142 | Excellent 56.2% |
| Seminole | 81.7 /100 | #143 | Excellent 56.2% |
| Immigrants | Syria | 81.4 /100 | #144 | Excellent 56.2% |
| Syrians | 81.2 /100 | #145 | Excellent 56.2% |
| Venezuelans | 80.7 /100 | #146 | Excellent 56.1% |
| Serbians | 80.3 /100 | #147 | Excellent 56.1% |
| Immigrants | Moldova | 80.2 /100 | #148 | Excellent 56.1% |
| Chileans | 80.2 /100 | #149 | Excellent 56.1% |