Lumbee vs Immigrants from Kazakhstan 4th Grade
COMPARE
Lumbee
Immigrants from Kazakhstan
4th Grade
4th Grade Comparison
Lumbee
Immigrants from Kazakhstan
98.0%
4TH GRADE
99.6/ 100
METRIC RATING
71st/ 347
METRIC RANK
97.5%
4TH GRADE
43.6/ 100
METRIC RATING
179th/ 347
METRIC RANK
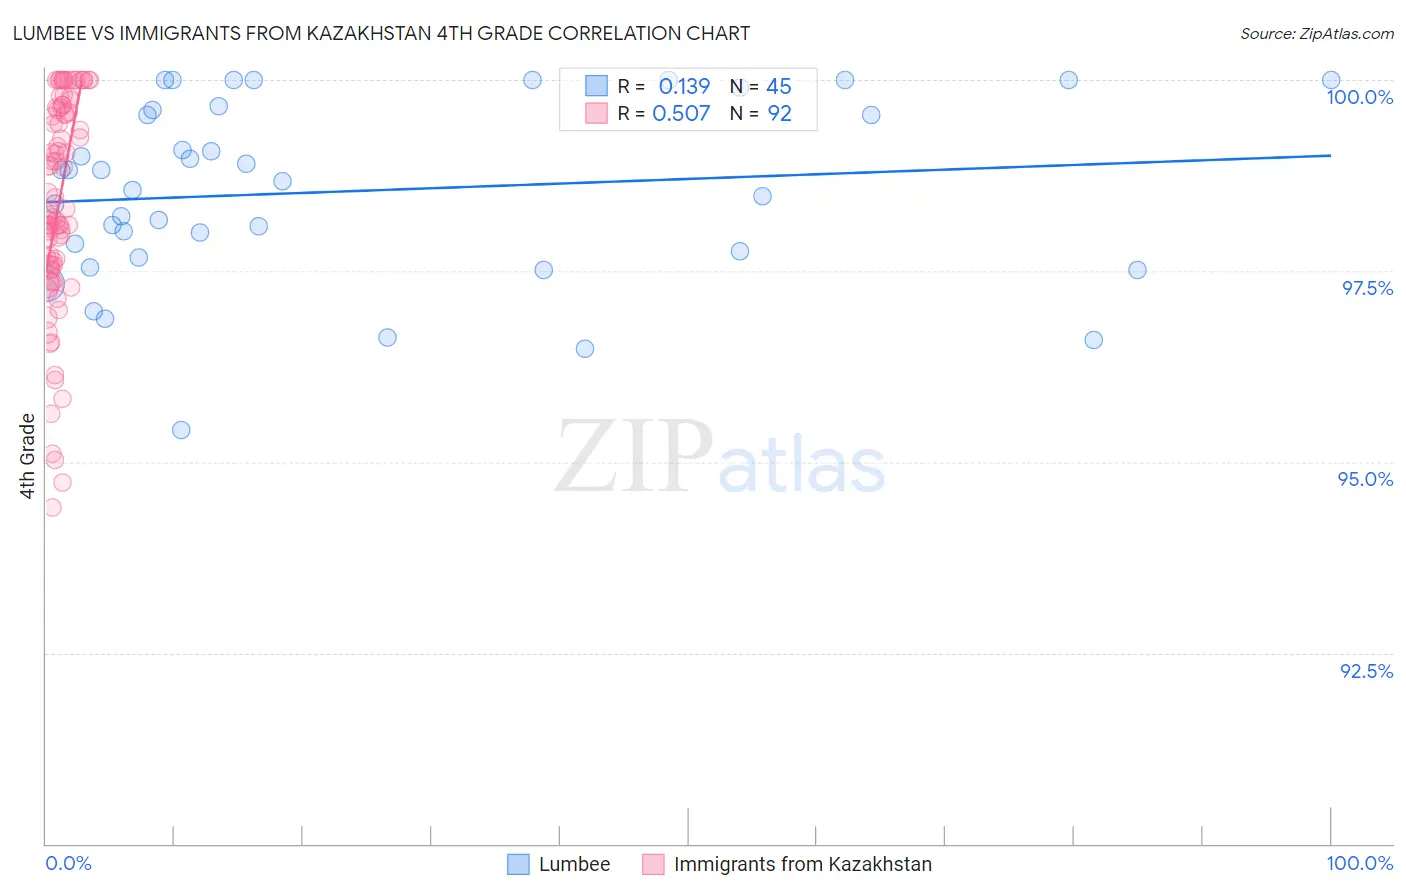
Lumbee vs Immigrants from Kazakhstan 4th Grade Correlation Chart
The statistical analysis conducted on geographies consisting of 92,298,549 people shows a poor positive correlation between the proportion of Lumbee and percentage of population with at least 4th grade education in the United States with a correlation coefficient (R) of 0.139 and weighted average of 98.0%. Similarly, the statistical analysis conducted on geographies consisting of 124,430,097 people shows a substantial positive correlation between the proportion of Immigrants from Kazakhstan and percentage of population with at least 4th grade education in the United States with a correlation coefficient (R) of 0.507 and weighted average of 97.5%, a difference of 0.54%.
4th Grade Correlation Summary
| Measurement | Lumbee | Immigrants from Kazakhstan |
| Minimum | 95.4% | 94.4% |
| Maximum | 100.0% | 100.0% |
| Range | 4.6% | 5.6% |
| Mean | 98.5% | 98.4% |
| Median | 98.7% | 98.3% |
| Interquartile 25% (IQ1) | 97.7% | 97.6% |
| Interquartile 75% (IQ3) | 99.6% | 99.6% |
| Interquartile Range (IQR) | 1.9% | 2.0% |
| Standard Deviation (Sample) | 1.2% | 1.4% |
| Standard Deviation (Population) | 1.2% | 1.4% |
Similar Demographics by 4th Grade
Demographics Similar to Lumbee by 4th Grade
In terms of 4th grade, the demographic groups most similar to Lumbee are Kiowa (98.0%, a difference of 0.0%), Pueblo (98.0%, a difference of 0.0%), Immigrants from Austria (98.0%, a difference of 0.0%), Immigrants from Northern Europe (98.0%, a difference of 0.010%), and Canadian (98.0%, a difference of 0.010%).
| Demographics | Rating | Rank | 4th Grade |
| Cajuns | 99.7 /100 | #64 | Exceptional 98.0% |
| Immigrants | Northern Europe | 99.6 /100 | #65 | Exceptional 98.0% |
| Canadians | 99.6 /100 | #66 | Exceptional 98.0% |
| New Zealanders | 99.6 /100 | #67 | Exceptional 98.0% |
| Kiowa | 99.6 /100 | #68 | Exceptional 98.0% |
| Pueblo | 99.6 /100 | #69 | Exceptional 98.0% |
| Immigrants | Austria | 99.6 /100 | #70 | Exceptional 98.0% |
| Lumbee | 99.6 /100 | #71 | Exceptional 98.0% |
| Iranians | 99.4 /100 | #72 | Exceptional 98.0% |
| Macedonians | 99.4 /100 | #73 | Exceptional 98.0% |
| Chickasaw | 99.4 /100 | #74 | Exceptional 98.0% |
| Immigrants | Netherlands | 99.3 /100 | #75 | Exceptional 98.0% |
| Cherokee | 99.3 /100 | #76 | Exceptional 98.0% |
| Immigrants | Lithuania | 99.3 /100 | #77 | Exceptional 98.0% |
| Immigrants | England | 99.3 /100 | #78 | Exceptional 98.0% |
Demographics Similar to Immigrants from Kazakhstan by 4th Grade
In terms of 4th grade, the demographic groups most similar to Immigrants from Kazakhstan are Immigrants from Venezuela (97.5%, a difference of 0.0%), Immigrants from Brazil (97.5%, a difference of 0.010%), Comanche (97.5%, a difference of 0.010%), Immigrants from Taiwan (97.5%, a difference of 0.010%), and Egyptian (97.5%, a difference of 0.020%).
| Demographics | Rating | Rank | 4th Grade |
| Immigrants | Sri Lanka | 51.1 /100 | #172 | Average 97.5% |
| Immigrants | Korea | 50.6 /100 | #173 | Average 97.5% |
| Egyptians | 50.0 /100 | #174 | Average 97.5% |
| Immigrants | Micronesia | 49.6 /100 | #175 | Average 97.5% |
| Arabs | 48.7 /100 | #176 | Average 97.5% |
| Immigrants | Brazil | 46.1 /100 | #177 | Average 97.5% |
| Comanche | 45.3 /100 | #178 | Average 97.5% |
| Immigrants | Kazakhstan | 43.6 /100 | #179 | Average 97.5% |
| Immigrants | Venezuela | 42.7 /100 | #180 | Average 97.5% |
| Immigrants | Taiwan | 41.5 /100 | #181 | Average 97.5% |
| Spanish Americans | 39.3 /100 | #182 | Fair 97.5% |
| Argentineans | 39.0 /100 | #183 | Fair 97.5% |
| Pakistanis | 36.2 /100 | #184 | Fair 97.5% |
| Immigrants | Kenya | 35.8 /100 | #185 | Fair 97.5% |
| Dutch West Indians | 35.8 /100 | #186 | Fair 97.5% |