Lumbee vs Immigrants from Kazakhstan In Labor Force | Age 20-24
COMPARE
Lumbee
Immigrants from Kazakhstan
In Labor Force | Age 20-24
In Labor Force | Age 20-24 Comparison
Lumbee
Immigrants from Kazakhstan
65.5%
IN LABOR FORCE | AGE 20-24
0.0/ 100
METRIC RATING
346th/ 347
METRIC RANK
73.8%
IN LABOR FORCE | AGE 20-24
1.1/ 100
METRIC RATING
252nd/ 347
METRIC RANK
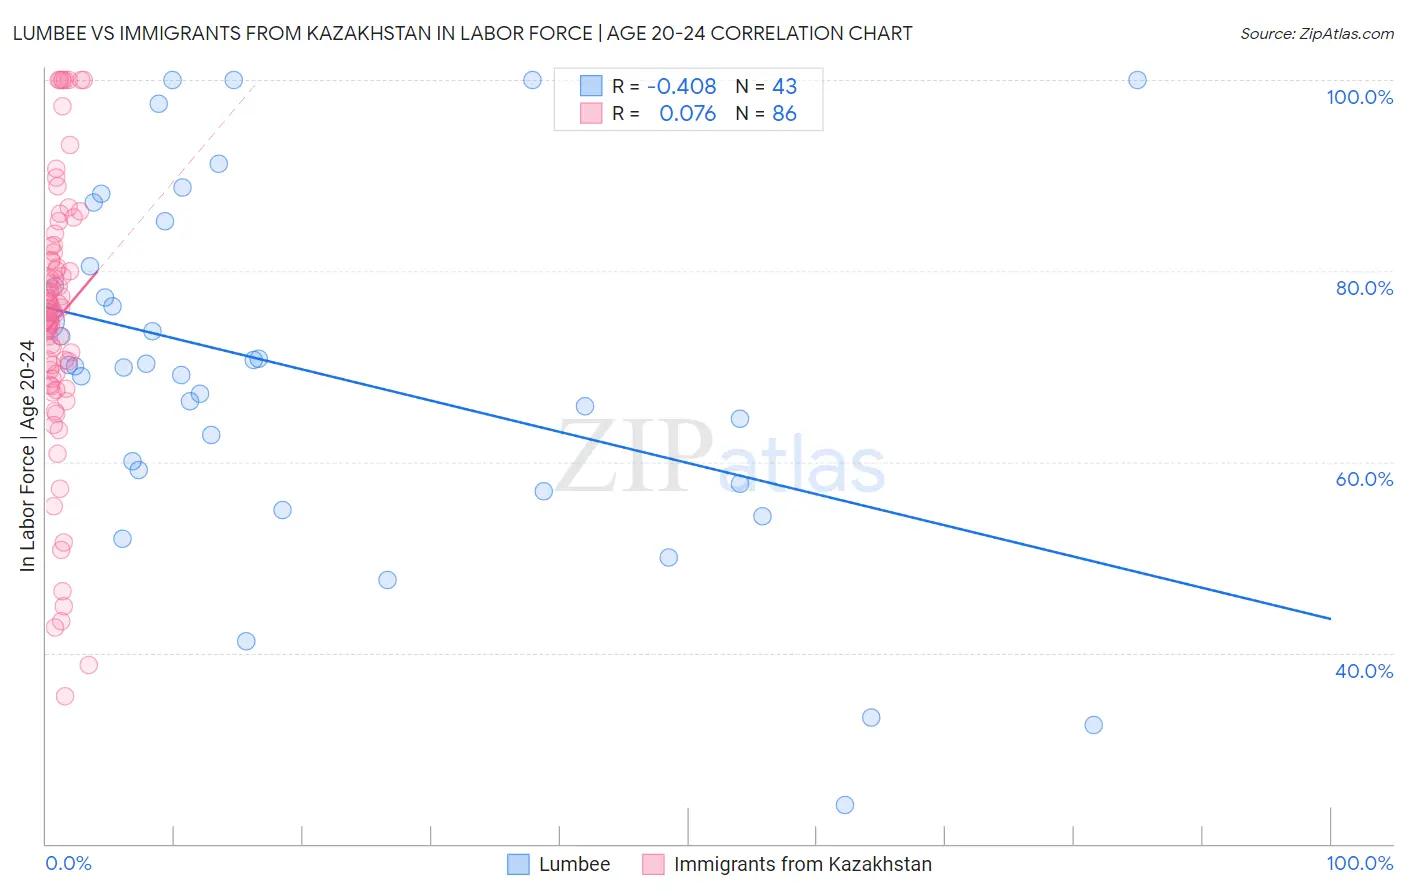
Lumbee vs Immigrants from Kazakhstan In Labor Force | Age 20-24 Correlation Chart
The statistical analysis conducted on geographies consisting of 92,285,947 people shows a moderate negative correlation between the proportion of Lumbee and labor force participation rate among population between the ages 20 and 24 in the United States with a correlation coefficient (R) of -0.408 and weighted average of 65.5%. Similarly, the statistical analysis conducted on geographies consisting of 124,438,220 people shows a slight positive correlation between the proportion of Immigrants from Kazakhstan and labor force participation rate among population between the ages 20 and 24 in the United States with a correlation coefficient (R) of 0.076 and weighted average of 73.8%, a difference of 12.7%.
In Labor Force | Age 20-24 Correlation Summary
| Measurement | Lumbee | Immigrants from Kazakhstan |
| Minimum | 24.0% | 35.5% |
| Maximum | 100.0% | 100.0% |
| Range | 76.0% | 64.5% |
| Mean | 69.3% | 75.0% |
| Median | 70.0% | 76.0% |
| Interquartile 25% (IQ1) | 57.7% | 68.8% |
| Interquartile 75% (IQ3) | 80.5% | 82.0% |
| Interquartile Range (IQR) | 22.8% | 13.2% |
| Standard Deviation (Sample) | 18.5% | 14.3% |
| Standard Deviation (Population) | 18.3% | 14.2% |
Similar Demographics by In Labor Force | Age 20-24
Demographics Similar to Lumbee by In Labor Force | Age 20-24
In terms of in labor force | age 20-24, the demographic groups most similar to Lumbee are Hopi (66.0%, a difference of 0.79%), Navajo (64.8%, a difference of 1.1%), Immigrants from Grenada (67.2%, a difference of 2.5%), Puerto Rican (68.3%, a difference of 4.3%), and Immigrants from St. Vincent and the Grenadines (68.4%, a difference of 4.4%).
| Demographics | Rating | Rank | In Labor Force | Age 20-24 |
| Yuman | 0.0 /100 | #333 | Tragic 70.3% |
| British West Indians | 0.0 /100 | #334 | Tragic 70.0% |
| Immigrants | Barbados | 0.0 /100 | #335 | Tragic 69.7% |
| Immigrants | Guyana | 0.0 /100 | #336 | Tragic 69.3% |
| Guyanese | 0.0 /100 | #337 | Tragic 69.2% |
| Pima | 0.0 /100 | #338 | Tragic 69.0% |
| Immigrants | Yemen | 0.0 /100 | #339 | Tragic 68.9% |
| Menominee | 0.0 /100 | #340 | Tragic 68.7% |
| Tohono O'odham | 0.0 /100 | #341 | Tragic 68.6% |
| Immigrants | St. Vincent and the Grenadines | 0.0 /100 | #342 | Tragic 68.4% |
| Puerto Ricans | 0.0 /100 | #343 | Tragic 68.3% |
| Immigrants | Grenada | 0.0 /100 | #344 | Tragic 67.2% |
| Hopi | 0.0 /100 | #345 | Tragic 66.0% |
| Lumbee | 0.0 /100 | #346 | Tragic 65.5% |
| Navajo | 0.0 /100 | #347 | Tragic 64.8% |
Demographics Similar to Immigrants from Kazakhstan by In Labor Force | Age 20-24
In terms of in labor force | age 20-24, the demographic groups most similar to Immigrants from Kazakhstan are Immigrants from Egypt (73.8%, a difference of 0.020%), Black/African American (73.9%, a difference of 0.040%), Immigrants from Belgium (73.9%, a difference of 0.040%), Arapaho (73.8%, a difference of 0.040%), and Ute (73.8%, a difference of 0.050%).
| Demographics | Rating | Rank | In Labor Force | Age 20-24 |
| Turks | 1.8 /100 | #245 | Tragic 73.9% |
| Immigrants | Panama | 1.6 /100 | #246 | Tragic 73.9% |
| Colville | 1.5 /100 | #247 | Tragic 73.9% |
| Immigrants | Saudi Arabia | 1.5 /100 | #248 | Tragic 73.9% |
| Blacks/African Americans | 1.3 /100 | #249 | Tragic 73.9% |
| Immigrants | Belgium | 1.3 /100 | #250 | Tragic 73.9% |
| Immigrants | Egypt | 1.2 /100 | #251 | Tragic 73.8% |
| Immigrants | Kazakhstan | 1.1 /100 | #252 | Tragic 73.8% |
| Arapaho | 1.0 /100 | #253 | Tragic 73.8% |
| Ute | 1.0 /100 | #254 | Tragic 73.8% |
| Immigrants | Pakistan | 0.9 /100 | #255 | Tragic 73.8% |
| Spanish American Indians | 0.8 /100 | #256 | Tragic 73.7% |
| Paraguayans | 0.8 /100 | #257 | Tragic 73.7% |
| Egyptians | 0.7 /100 | #258 | Tragic 73.7% |
| Dutch West Indians | 0.7 /100 | #259 | Tragic 73.7% |