Liberian vs Sierra Leonean 3 or more Vehicles in Household
COMPARE
Liberian
Sierra Leonean
3 or more Vehicles in Household
3 or more Vehicles in Household Comparison
Liberians
Sierra Leoneans
17.0%
3 OR MORE VEHICLES IN HOUSEHOLD
0.1/ 100
METRIC RATING
290th/ 347
METRIC RANK
18.3%
3 OR MORE VEHICLES IN HOUSEHOLD
3.9/ 100
METRIC RATING
235th/ 347
METRIC RANK
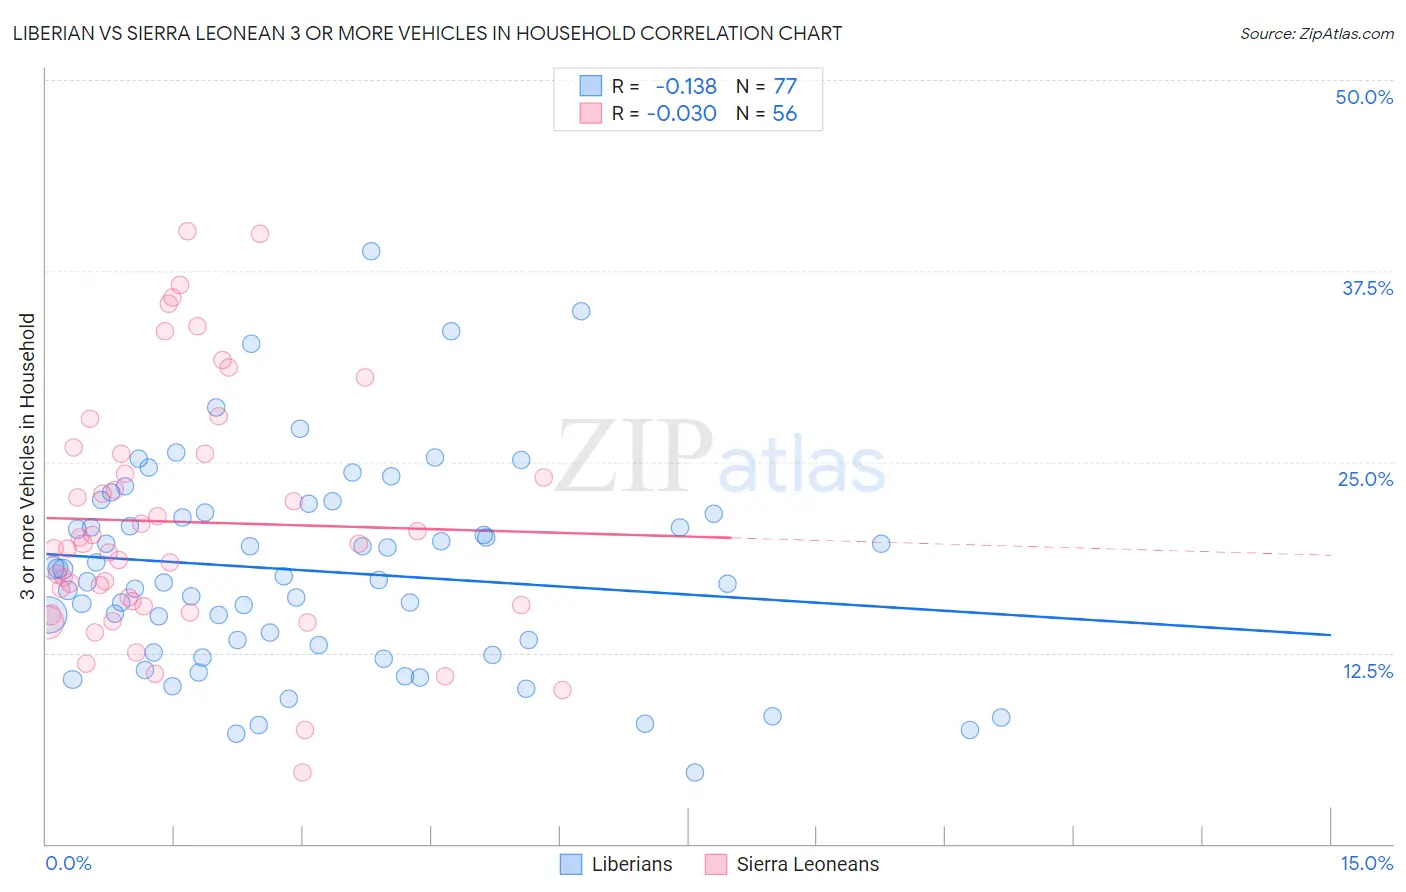
Liberian vs Sierra Leonean 3 or more Vehicles in Household Correlation Chart
The statistical analysis conducted on geographies consisting of 118,026,034 people shows a poor negative correlation between the proportion of Liberians and percentage of households with 3 or more vehicles available in the United States with a correlation coefficient (R) of -0.138 and weighted average of 17.0%. Similarly, the statistical analysis conducted on geographies consisting of 83,340,667 people shows no correlation between the proportion of Sierra Leoneans and percentage of households with 3 or more vehicles available in the United States with a correlation coefficient (R) of -0.030 and weighted average of 18.3%, a difference of 7.8%.
3 or more Vehicles in Household Correlation Summary
| Measurement | Liberian | Sierra Leonean |
| Minimum | 4.7% | 4.7% |
| Maximum | 38.8% | 40.1% |
| Range | 34.1% | 35.5% |
| Mean | 17.9% | 21.1% |
| Median | 17.2% | 19.5% |
| Interquartile 25% (IQ1) | 12.8% | 15.6% |
| Interquartile 75% (IQ3) | 21.7% | 25.5% |
| Interquartile Range (IQR) | 8.9% | 10.0% |
| Standard Deviation (Sample) | 6.7% | 8.1% |
| Standard Deviation (Population) | 6.7% | 8.0% |
Similar Demographics by 3 or more Vehicles in Household
Demographics Similar to Liberians by 3 or more Vehicles in Household
In terms of 3 or more vehicles in household, the demographic groups most similar to Liberians are Immigrants from Congo (17.0%, a difference of 0.15%), Immigrants from Spain (17.0%, a difference of 0.27%), Bahamian (16.9%, a difference of 0.35%), Immigrants from Western Africa (16.9%, a difference of 0.46%), and Immigrants from Russia (16.9%, a difference of 0.51%).
| Demographics | Rating | Rank | 3 or more Vehicles in Household |
| Blacks/African Americans | 0.3 /100 | #283 | Tragic 17.3% |
| Immigrants | Colombia | 0.3 /100 | #284 | Tragic 17.3% |
| Immigrants | Croatia | 0.2 /100 | #285 | Tragic 17.2% |
| Menominee | 0.2 /100 | #286 | Tragic 17.2% |
| Immigrants | Brazil | 0.2 /100 | #287 | Tragic 17.1% |
| Immigrants | Uruguay | 0.2 /100 | #288 | Tragic 17.1% |
| Immigrants | Liberia | 0.1 /100 | #289 | Tragic 17.1% |
| Liberians | 0.1 /100 | #290 | Tragic 17.0% |
| Immigrants | Congo | 0.1 /100 | #291 | Tragic 17.0% |
| Immigrants | Spain | 0.1 /100 | #292 | Tragic 17.0% |
| Bahamians | 0.1 /100 | #293 | Tragic 16.9% |
| Immigrants | Western Africa | 0.1 /100 | #294 | Tragic 16.9% |
| Immigrants | Russia | 0.1 /100 | #295 | Tragic 16.9% |
| Inupiat | 0.1 /100 | #296 | Tragic 16.9% |
| Israelis | 0.1 /100 | #297 | Tragic 16.8% |
Demographics Similar to Sierra Leoneans by 3 or more Vehicles in Household
In terms of 3 or more vehicles in household, the demographic groups most similar to Sierra Leoneans are Immigrants from Malaysia (18.3%, a difference of 0.18%), Indonesian (18.3%, a difference of 0.23%), Immigrants from North Macedonia (18.4%, a difference of 0.28%), Honduran (18.4%, a difference of 0.34%), and Immigrants from Uganda (18.4%, a difference of 0.36%).
| Demographics | Rating | Rank | 3 or more Vehicles in Household |
| Turks | 5.4 /100 | #228 | Tragic 18.4% |
| Immigrants | Switzerland | 5.0 /100 | #229 | Tragic 18.4% |
| Immigrants | Western Asia | 4.8 /100 | #230 | Tragic 18.4% |
| Immigrants | Belgium | 4.8 /100 | #231 | Tragic 18.4% |
| Immigrants | Uganda | 4.6 /100 | #232 | Tragic 18.4% |
| Hondurans | 4.6 /100 | #233 | Tragic 18.4% |
| Immigrants | North Macedonia | 4.4 /100 | #234 | Tragic 18.4% |
| Sierra Leoneans | 3.9 /100 | #235 | Tragic 18.3% |
| Immigrants | Malaysia | 3.6 /100 | #236 | Tragic 18.3% |
| Indonesians | 3.5 /100 | #237 | Tragic 18.3% |
| Immigrants | Honduras | 3.1 /100 | #238 | Tragic 18.2% |
| Immigrants | Middle Africa | 3.1 /100 | #239 | Tragic 18.2% |
| Immigrants | China | 2.9 /100 | #240 | Tragic 18.2% |
| Africans | 2.7 /100 | #241 | Tragic 18.2% |
| Hopi | 2.5 /100 | #242 | Tragic 18.2% |