Liberian vs Immigrants from Lithuania 3 or more Vehicles in Household
COMPARE
Liberian
Immigrants from Lithuania
3 or more Vehicles in Household
3 or more Vehicles in Household Comparison
Liberians
Immigrants from Lithuania
17.0%
3 OR MORE VEHICLES IN HOUSEHOLD
0.1/ 100
METRIC RATING
290th/ 347
METRIC RANK
18.5%
3 OR MORE VEHICLES IN HOUSEHOLD
5.6/ 100
METRIC RATING
225th/ 347
METRIC RANK
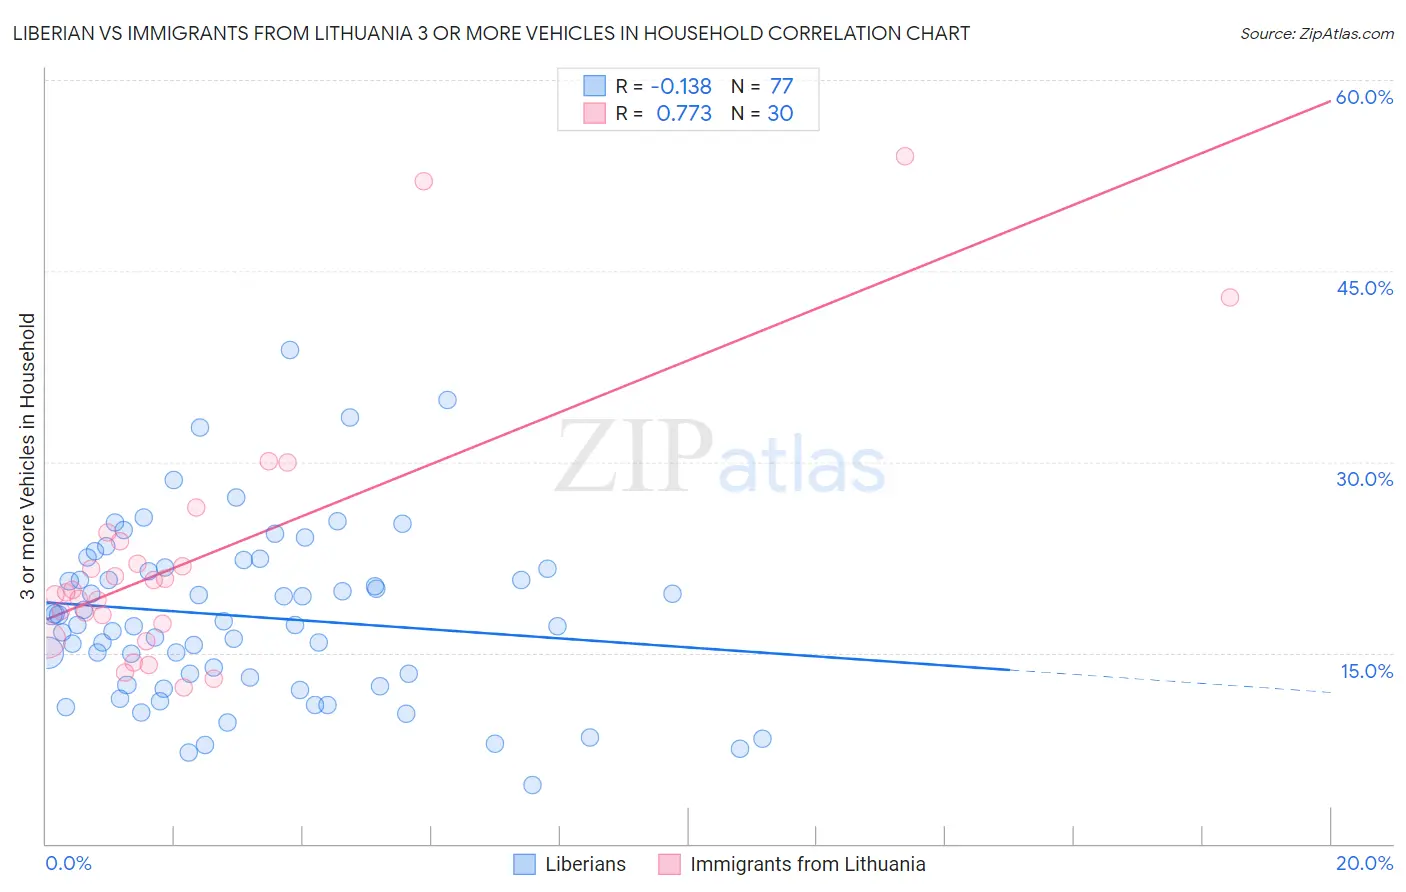
Liberian vs Immigrants from Lithuania 3 or more Vehicles in Household Correlation Chart
The statistical analysis conducted on geographies consisting of 118,026,034 people shows a poor negative correlation between the proportion of Liberians and percentage of households with 3 or more vehicles available in the United States with a correlation coefficient (R) of -0.138 and weighted average of 17.0%. Similarly, the statistical analysis conducted on geographies consisting of 117,713,976 people shows a strong positive correlation between the proportion of Immigrants from Lithuania and percentage of households with 3 or more vehicles available in the United States with a correlation coefficient (R) of 0.773 and weighted average of 18.5%, a difference of 8.6%.
3 or more Vehicles in Household Correlation Summary
| Measurement | Liberian | Immigrants from Lithuania |
| Minimum | 4.7% | 12.3% |
| Maximum | 38.8% | 54.1% |
| Range | 34.1% | 41.8% |
| Mean | 17.9% | 22.7% |
| Median | 17.2% | 19.8% |
| Interquartile 25% (IQ1) | 12.8% | 17.3% |
| Interquartile 75% (IQ3) | 21.7% | 23.8% |
| Interquartile Range (IQR) | 8.9% | 6.5% |
| Standard Deviation (Sample) | 6.7% | 10.3% |
| Standard Deviation (Population) | 6.7% | 10.1% |
Similar Demographics by 3 or more Vehicles in Household
Demographics Similar to Liberians by 3 or more Vehicles in Household
In terms of 3 or more vehicles in household, the demographic groups most similar to Liberians are Immigrants from Congo (17.0%, a difference of 0.15%), Immigrants from Spain (17.0%, a difference of 0.27%), Bahamian (16.9%, a difference of 0.35%), Immigrants from Western Africa (16.9%, a difference of 0.46%), and Immigrants from Russia (16.9%, a difference of 0.51%).
| Demographics | Rating | Rank | 3 or more Vehicles in Household |
| Blacks/African Americans | 0.3 /100 | #283 | Tragic 17.3% |
| Immigrants | Colombia | 0.3 /100 | #284 | Tragic 17.3% |
| Immigrants | Croatia | 0.2 /100 | #285 | Tragic 17.2% |
| Menominee | 0.2 /100 | #286 | Tragic 17.2% |
| Immigrants | Brazil | 0.2 /100 | #287 | Tragic 17.1% |
| Immigrants | Uruguay | 0.2 /100 | #288 | Tragic 17.1% |
| Immigrants | Liberia | 0.1 /100 | #289 | Tragic 17.1% |
| Liberians | 0.1 /100 | #290 | Tragic 17.0% |
| Immigrants | Congo | 0.1 /100 | #291 | Tragic 17.0% |
| Immigrants | Spain | 0.1 /100 | #292 | Tragic 17.0% |
| Bahamians | 0.1 /100 | #293 | Tragic 16.9% |
| Immigrants | Western Africa | 0.1 /100 | #294 | Tragic 16.9% |
| Immigrants | Russia | 0.1 /100 | #295 | Tragic 16.9% |
| Inupiat | 0.1 /100 | #296 | Tragic 16.9% |
| Israelis | 0.1 /100 | #297 | Tragic 16.8% |
Demographics Similar to Immigrants from Lithuania by 3 or more Vehicles in Household
In terms of 3 or more vehicles in household, the demographic groups most similar to Immigrants from Lithuania are Immigrants from Argentina (18.5%, a difference of 0.010%), Immigrants from Hungary (18.5%, a difference of 0.030%), Immigrants from Singapore (18.4%, a difference of 0.060%), Turkish (18.4%, a difference of 0.080%), and Immigrants from Czechoslovakia (18.5%, a difference of 0.11%).
| Demographics | Rating | Rank | 3 or more Vehicles in Household |
| Immigrants | Portugal | 8.9 /100 | #218 | Tragic 18.6% |
| Immigrants | Armenia | 8.6 /100 | #219 | Tragic 18.6% |
| Nigerians | 7.9 /100 | #220 | Tragic 18.6% |
| Immigrants | Poland | 7.5 /100 | #221 | Tragic 18.6% |
| Belizeans | 7.3 /100 | #222 | Tragic 18.6% |
| Immigrants | Czechoslovakia | 5.9 /100 | #223 | Tragic 18.5% |
| Immigrants | Argentina | 5.6 /100 | #224 | Tragic 18.5% |
| Immigrants | Lithuania | 5.6 /100 | #225 | Tragic 18.5% |
| Immigrants | Hungary | 5.5 /100 | #226 | Tragic 18.5% |
| Immigrants | Singapore | 5.4 /100 | #227 | Tragic 18.4% |
| Turks | 5.4 /100 | #228 | Tragic 18.4% |
| Immigrants | Switzerland | 5.0 /100 | #229 | Tragic 18.4% |
| Immigrants | Western Asia | 4.8 /100 | #230 | Tragic 18.4% |
| Immigrants | Belgium | 4.8 /100 | #231 | Tragic 18.4% |
| Immigrants | Uganda | 4.6 /100 | #232 | Tragic 18.4% |