Liberian vs Immigrants from Ukraine 3 or more Vehicles in Household
COMPARE
Liberian
Immigrants from Ukraine
3 or more Vehicles in Household
3 or more Vehicles in Household Comparison
Liberians
Immigrants from Ukraine
17.0%
3 OR MORE VEHICLES IN HOUSEHOLD
0.1/ 100
METRIC RATING
290th/ 347
METRIC RANK
17.5%
3 OR MORE VEHICLES IN HOUSEHOLD
0.4/ 100
METRIC RATING
275th/ 347
METRIC RANK
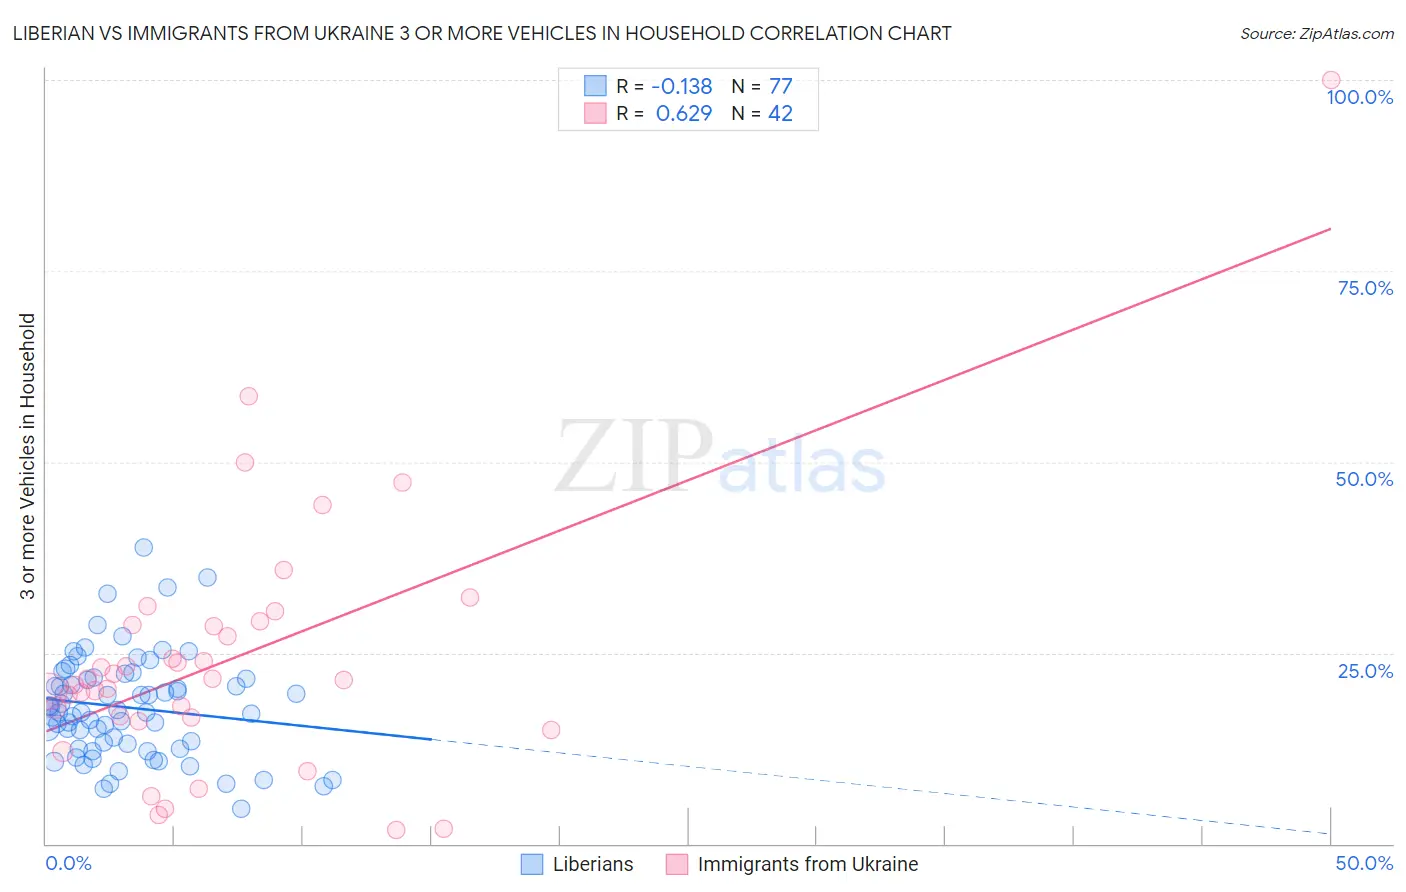
Liberian vs Immigrants from Ukraine 3 or more Vehicles in Household Correlation Chart
The statistical analysis conducted on geographies consisting of 118,026,034 people shows a poor negative correlation between the proportion of Liberians and percentage of households with 3 or more vehicles available in the United States with a correlation coefficient (R) of -0.138 and weighted average of 17.0%. Similarly, the statistical analysis conducted on geographies consisting of 289,525,273 people shows a significant positive correlation between the proportion of Immigrants from Ukraine and percentage of households with 3 or more vehicles available in the United States with a correlation coefficient (R) of 0.629 and weighted average of 17.5%, a difference of 2.8%.
3 or more Vehicles in Household Correlation Summary
| Measurement | Liberian | Immigrants from Ukraine |
| Minimum | 4.7% | 1.8% |
| Maximum | 38.8% | 100.0% |
| Range | 34.1% | 98.2% |
| Mean | 17.9% | 24.2% |
| Median | 17.2% | 21.5% |
| Interquartile 25% (IQ1) | 12.8% | 16.6% |
| Interquartile 75% (IQ3) | 21.7% | 28.7% |
| Interquartile Range (IQR) | 8.9% | 12.1% |
| Standard Deviation (Sample) | 6.7% | 17.2% |
| Standard Deviation (Population) | 6.7% | 17.0% |
Demographics Similar to Liberians and Immigrants from Ukraine by 3 or more Vehicles in Household
In terms of 3 or more vehicles in household, the demographic groups most similar to Liberians are Immigrants from Congo (17.0%, a difference of 0.15%), Immigrants from Spain (17.0%, a difference of 0.27%), Immigrants from Liberia (17.1%, a difference of 0.57%), Immigrants from Uruguay (17.1%, a difference of 0.64%), and Immigrants from Brazil (17.1%, a difference of 0.73%). Similarly, the demographic groups most similar to Immigrants from Ukraine are Okinawan (17.4%, a difference of 0.16%), Immigrants from Bosnia and Herzegovina (17.5%, a difference of 0.29%), Brazilian (17.4%, a difference of 0.30%), Immigrants from Bahamas (17.4%, a difference of 0.39%), and Immigrants from Kazakhstan (17.4%, a difference of 0.41%).
| Demographics | Rating | Rank | 3 or more Vehicles in Household |
| Immigrants | Africa | 0.5 /100 | #272 | Tragic 17.6% |
| Immigrants | Sudan | 0.5 /100 | #273 | Tragic 17.6% |
| Immigrants | Bosnia and Herzegovina | 0.5 /100 | #274 | Tragic 17.5% |
| Immigrants | Ukraine | 0.4 /100 | #275 | Tragic 17.5% |
| Okinawans | 0.4 /100 | #276 | Tragic 17.4% |
| Brazilians | 0.4 /100 | #277 | Tragic 17.4% |
| Immigrants | Bahamas | 0.3 /100 | #278 | Tragic 17.4% |
| Immigrants | Kazakhstan | 0.3 /100 | #279 | Tragic 17.4% |
| Immigrants | Eastern Europe | 0.3 /100 | #280 | Tragic 17.4% |
| Immigrants | Latvia | 0.3 /100 | #281 | Tragic 17.4% |
| Immigrants | Ireland | 0.3 /100 | #282 | Tragic 17.3% |
| Blacks/African Americans | 0.3 /100 | #283 | Tragic 17.3% |
| Immigrants | Colombia | 0.3 /100 | #284 | Tragic 17.3% |
| Immigrants | Croatia | 0.2 /100 | #285 | Tragic 17.2% |
| Menominee | 0.2 /100 | #286 | Tragic 17.2% |
| Immigrants | Brazil | 0.2 /100 | #287 | Tragic 17.1% |
| Immigrants | Uruguay | 0.2 /100 | #288 | Tragic 17.1% |
| Immigrants | Liberia | 0.1 /100 | #289 | Tragic 17.1% |
| Liberians | 0.1 /100 | #290 | Tragic 17.0% |
| Immigrants | Congo | 0.1 /100 | #291 | Tragic 17.0% |
| Immigrants | Spain | 0.1 /100 | #292 | Tragic 17.0% |