Liberian vs Sierra Leonean College, Under 1 year
COMPARE
Liberian
Sierra Leonean
College, Under 1 year
College, Under 1 year Comparison
Liberians
Sierra Leoneans
63.0%
COLLEGE, UNDER 1 YEAR
3.2/ 100
METRIC RATING
229th/ 347
METRIC RANK
66.0%
COLLEGE, UNDER 1 YEAR
67.8/ 100
METRIC RATING
157th/ 347
METRIC RANK
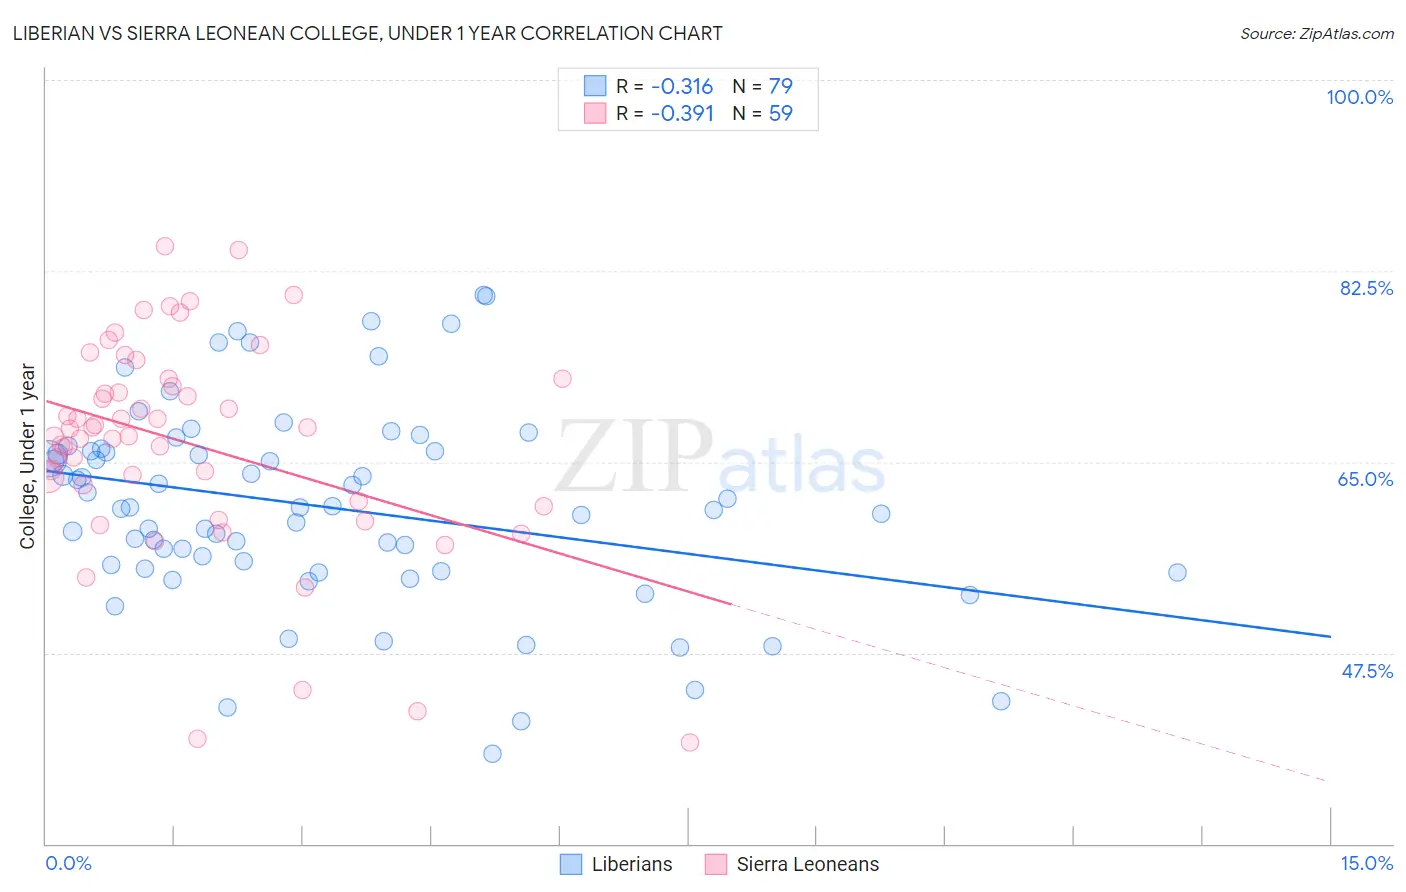
Liberian vs Sierra Leonean College, Under 1 year Correlation Chart
The statistical analysis conducted on geographies consisting of 118,090,659 people shows a mild negative correlation between the proportion of Liberians and percentage of population with at least college, under 1 year education in the United States with a correlation coefficient (R) of -0.316 and weighted average of 63.0%. Similarly, the statistical analysis conducted on geographies consisting of 83,362,711 people shows a mild negative correlation between the proportion of Sierra Leoneans and percentage of population with at least college, under 1 year education in the United States with a correlation coefficient (R) of -0.391 and weighted average of 66.0%, a difference of 4.8%.
College, Under 1 year Correlation Summary
| Measurement | Liberian | Sierra Leonean |
| Minimum | 38.3% | 39.3% |
| Maximum | 80.3% | 84.7% |
| Range | 42.0% | 45.5% |
| Mean | 60.9% | 66.7% |
| Median | 60.8% | 68.1% |
| Interquartile 25% (IQ1) | 55.2% | 61.4% |
| Interquartile 75% (IQ3) | 66.0% | 72.6% |
| Interquartile Range (IQR) | 10.8% | 11.2% |
| Standard Deviation (Sample) | 9.1% | 9.9% |
| Standard Deviation (Population) | 9.0% | 9.8% |
Similar Demographics by College, Under 1 year
Demographics Similar to Liberians by College, Under 1 year
In terms of college, under 1 year, the demographic groups most similar to Liberians are Samoan (63.0%, a difference of 0.050%), Nonimmigrants (62.9%, a difference of 0.070%), Immigrants from Ghana (63.1%, a difference of 0.17%), Immigrants from Colombia (63.1%, a difference of 0.26%), and Immigrants from Peru (63.1%, a difference of 0.27%).
| Demographics | Rating | Rank | College, Under 1 year |
| Immigrants | Senegal | 5.0 /100 | #222 | Tragic 63.3% |
| Immigrants | Costa Rica | 4.5 /100 | #223 | Tragic 63.2% |
| Sub-Saharan Africans | 4.4 /100 | #224 | Tragic 63.2% |
| Immigrants | Peru | 4.0 /100 | #225 | Tragic 63.1% |
| Immigrants | Colombia | 4.0 /100 | #226 | Tragic 63.1% |
| Immigrants | Ghana | 3.7 /100 | #227 | Tragic 63.1% |
| Samoans | 3.3 /100 | #228 | Tragic 63.0% |
| Liberians | 3.2 /100 | #229 | Tragic 63.0% |
| Immigrants | Nonimmigrants | 3.0 /100 | #230 | Tragic 62.9% |
| Immigrants | Western Africa | 2.4 /100 | #231 | Tragic 62.8% |
| Osage | 2.2 /100 | #232 | Tragic 62.7% |
| Iroquois | 2.0 /100 | #233 | Tragic 62.6% |
| Chippewa | 2.0 /100 | #234 | Tragic 62.6% |
| Spanish Americans | 1.9 /100 | #235 | Tragic 62.6% |
| Immigrants | Immigrants | 1.7 /100 | #236 | Tragic 62.5% |
Demographics Similar to Sierra Leoneans by College, Under 1 year
In terms of college, under 1 year, the demographic groups most similar to Sierra Leoneans are Celtic (65.9%, a difference of 0.030%), Tlingit-Haida (65.9%, a difference of 0.070%), Albanian (65.9%, a difference of 0.080%), Brazilian (65.9%, a difference of 0.090%), and Welsh (66.0%, a difference of 0.10%).
| Demographics | Rating | Rank | College, Under 1 year |
| Immigrants | Iraq | 77.1 /100 | #150 | Good 66.3% |
| Immigrants | Sudan | 76.0 /100 | #151 | Good 66.2% |
| Sudanese | 74.1 /100 | #152 | Good 66.2% |
| Belgians | 73.7 /100 | #153 | Good 66.2% |
| Immigrants | Eritrea | 71.9 /100 | #154 | Good 66.1% |
| Irish | 70.3 /100 | #155 | Good 66.0% |
| Welsh | 69.9 /100 | #156 | Good 66.0% |
| Sierra Leoneans | 67.8 /100 | #157 | Good 66.0% |
| Celtics | 67.3 /100 | #158 | Good 65.9% |
| Tlingit-Haida | 66.4 /100 | #159 | Good 65.9% |
| Albanians | 66.1 /100 | #160 | Good 65.9% |
| Brazilians | 66.0 /100 | #161 | Good 65.9% |
| Koreans | 65.3 /100 | #162 | Good 65.9% |
| Somalis | 62.7 /100 | #163 | Good 65.8% |
| Czechoslovakians | 62.6 /100 | #164 | Good 65.8% |