Liberian vs Potawatomi 3 or more Vehicles in Household
COMPARE
Liberian
Potawatomi
3 or more Vehicles in Household
3 or more Vehicles in Household Comparison
Liberians
Potawatomi
17.0%
3 OR MORE VEHICLES IN HOUSEHOLD
0.1/ 100
METRIC RATING
290th/ 347
METRIC RANK
21.9%
3 OR MORE VEHICLES IN HOUSEHOLD
99.8/ 100
METRIC RATING
71st/ 347
METRIC RANK
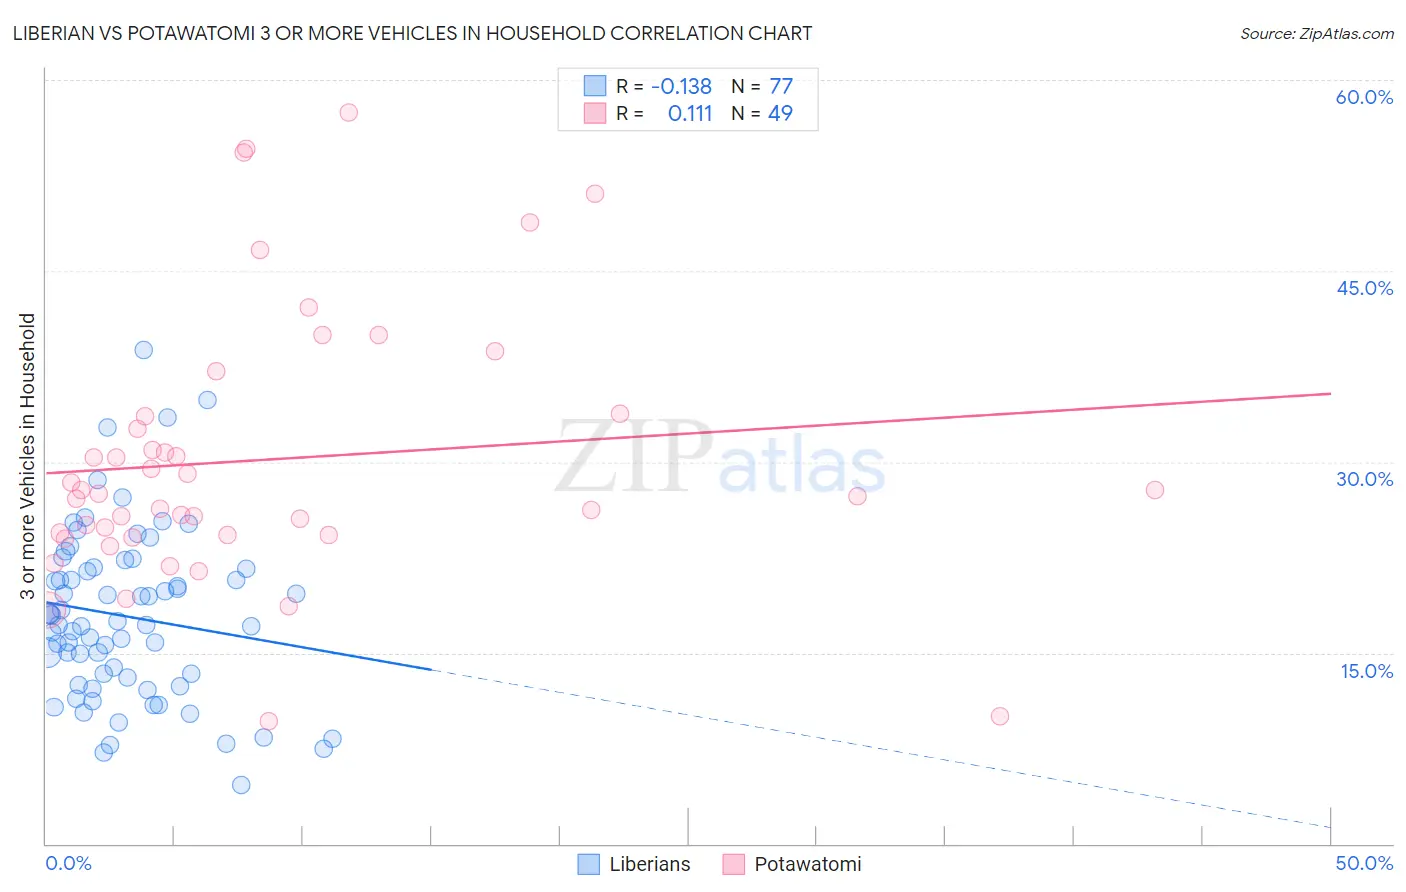
Liberian vs Potawatomi 3 or more Vehicles in Household Correlation Chart
The statistical analysis conducted on geographies consisting of 118,026,034 people shows a poor negative correlation between the proportion of Liberians and percentage of households with 3 or more vehicles available in the United States with a correlation coefficient (R) of -0.138 and weighted average of 17.0%. Similarly, the statistical analysis conducted on geographies consisting of 117,753,482 people shows a poor positive correlation between the proportion of Potawatomi and percentage of households with 3 or more vehicles available in the United States with a correlation coefficient (R) of 0.111 and weighted average of 21.9%, a difference of 28.6%.
3 or more Vehicles in Household Correlation Summary
| Measurement | Liberian | Potawatomi |
| Minimum | 4.7% | 9.7% |
| Maximum | 38.8% | 57.4% |
| Range | 34.1% | 47.8% |
| Mean | 17.9% | 30.2% |
| Median | 17.2% | 27.5% |
| Interquartile 25% (IQ1) | 12.8% | 24.2% |
| Interquartile 75% (IQ3) | 21.7% | 33.7% |
| Interquartile Range (IQR) | 8.9% | 9.4% |
| Standard Deviation (Sample) | 6.7% | 10.5% |
| Standard Deviation (Population) | 6.7% | 10.4% |
Similar Demographics by 3 or more Vehicles in Household
Demographics Similar to Liberians by 3 or more Vehicles in Household
In terms of 3 or more vehicles in household, the demographic groups most similar to Liberians are Immigrants from Congo (17.0%, a difference of 0.15%), Immigrants from Spain (17.0%, a difference of 0.27%), Bahamian (16.9%, a difference of 0.35%), Immigrants from Western Africa (16.9%, a difference of 0.46%), and Immigrants from Russia (16.9%, a difference of 0.51%).
| Demographics | Rating | Rank | 3 or more Vehicles in Household |
| Blacks/African Americans | 0.3 /100 | #283 | Tragic 17.3% |
| Immigrants | Colombia | 0.3 /100 | #284 | Tragic 17.3% |
| Immigrants | Croatia | 0.2 /100 | #285 | Tragic 17.2% |
| Menominee | 0.2 /100 | #286 | Tragic 17.2% |
| Immigrants | Brazil | 0.2 /100 | #287 | Tragic 17.1% |
| Immigrants | Uruguay | 0.2 /100 | #288 | Tragic 17.1% |
| Immigrants | Liberia | 0.1 /100 | #289 | Tragic 17.1% |
| Liberians | 0.1 /100 | #290 | Tragic 17.0% |
| Immigrants | Congo | 0.1 /100 | #291 | Tragic 17.0% |
| Immigrants | Spain | 0.1 /100 | #292 | Tragic 17.0% |
| Bahamians | 0.1 /100 | #293 | Tragic 16.9% |
| Immigrants | Western Africa | 0.1 /100 | #294 | Tragic 16.9% |
| Immigrants | Russia | 0.1 /100 | #295 | Tragic 16.9% |
| Inupiat | 0.1 /100 | #296 | Tragic 16.9% |
| Israelis | 0.1 /100 | #297 | Tragic 16.8% |
Demographics Similar to Potawatomi by 3 or more Vehicles in Household
In terms of 3 or more vehicles in household, the demographic groups most similar to Potawatomi are Bangladeshi (21.9%, a difference of 0.010%), Portuguese (21.8%, a difference of 0.18%), Creek (21.9%, a difference of 0.20%), British (21.9%, a difference of 0.23%), and Salvadoran (21.8%, a difference of 0.27%).
| Demographics | Rating | Rank | 3 or more Vehicles in Household |
| Immigrants | Taiwan | 99.9 /100 | #64 | Exceptional 22.1% |
| Pima | 99.9 /100 | #65 | Exceptional 22.0% |
| Northern Europeans | 99.9 /100 | #66 | Exceptional 22.0% |
| Alaskan Athabascans | 99.9 /100 | #67 | Exceptional 21.9% |
| British | 99.9 /100 | #68 | Exceptional 21.9% |
| Creek | 99.9 /100 | #69 | Exceptional 21.9% |
| Bangladeshis | 99.8 /100 | #70 | Exceptional 21.9% |
| Potawatomi | 99.8 /100 | #71 | Exceptional 21.9% |
| Portuguese | 99.8 /100 | #72 | Exceptional 21.8% |
| Salvadorans | 99.8 /100 | #73 | Exceptional 21.8% |
| Immigrants | Oceania | 99.8 /100 | #74 | Exceptional 21.8% |
| Japanese | 99.8 /100 | #75 | Exceptional 21.8% |
| Immigrants | Nonimmigrants | 99.8 /100 | #76 | Exceptional 21.8% |
| Irish | 99.8 /100 | #77 | Exceptional 21.8% |
| Czechoslovakians | 99.8 /100 | #78 | Exceptional 21.7% |