Liberian vs Immigrants from Ethiopia 3 or more Vehicles in Household
COMPARE
Liberian
Immigrants from Ethiopia
3 or more Vehicles in Household
3 or more Vehicles in Household Comparison
Liberians
Immigrants from Ethiopia
17.0%
3 OR MORE VEHICLES IN HOUSEHOLD
0.1/ 100
METRIC RATING
290th/ 347
METRIC RANK
17.9%
3 OR MORE VEHICLES IN HOUSEHOLD
1.3/ 100
METRIC RATING
253rd/ 347
METRIC RANK
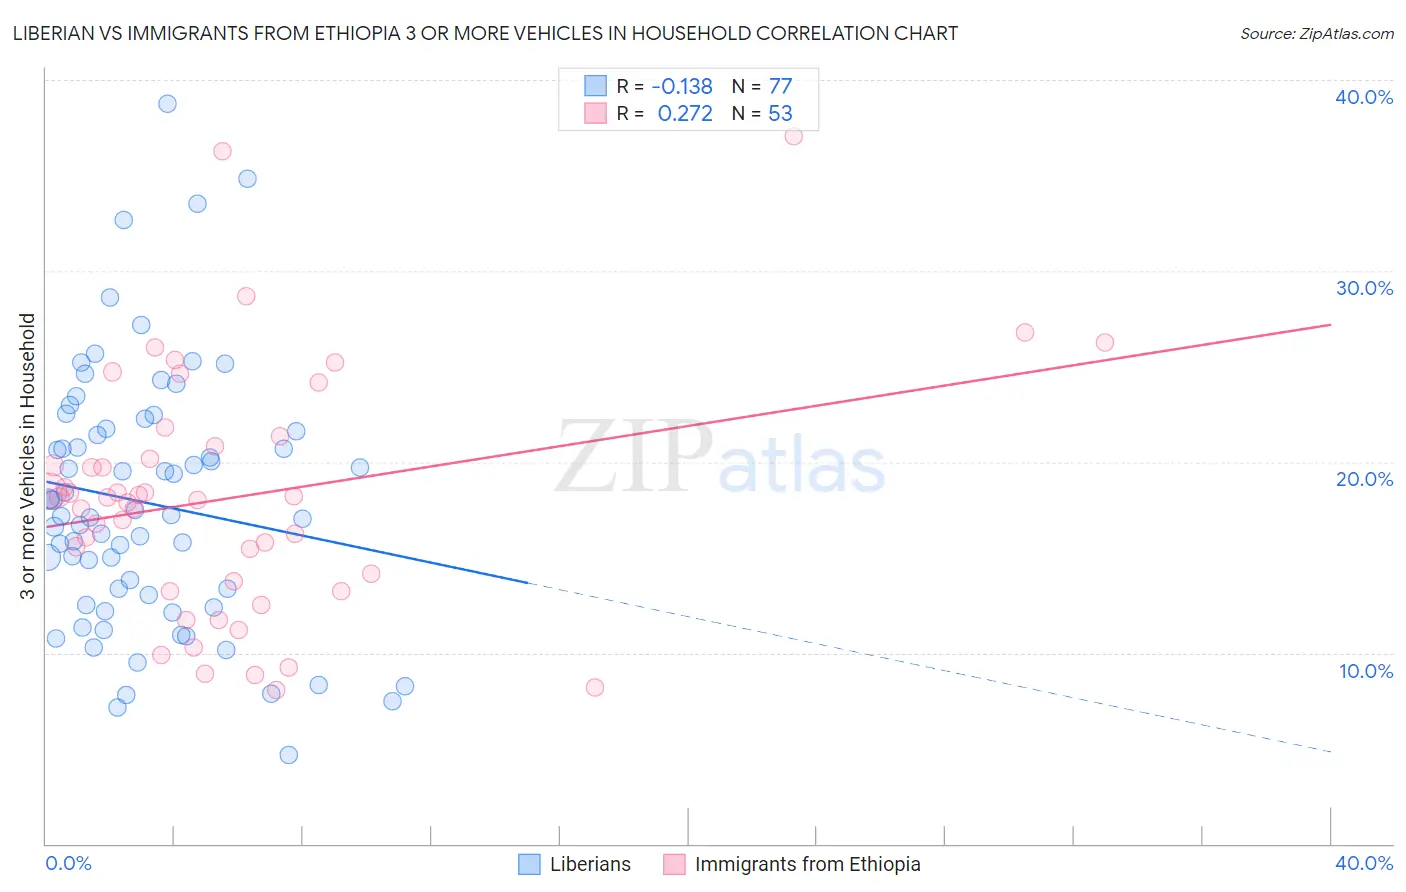
Liberian vs Immigrants from Ethiopia 3 or more Vehicles in Household Correlation Chart
The statistical analysis conducted on geographies consisting of 118,026,034 people shows a poor negative correlation between the proportion of Liberians and percentage of households with 3 or more vehicles available in the United States with a correlation coefficient (R) of -0.138 and weighted average of 17.0%. Similarly, the statistical analysis conducted on geographies consisting of 211,428,761 people shows a weak positive correlation between the proportion of Immigrants from Ethiopia and percentage of households with 3 or more vehicles available in the United States with a correlation coefficient (R) of 0.272 and weighted average of 17.9%, a difference of 5.2%.
3 or more Vehicles in Household Correlation Summary
| Measurement | Liberian | Immigrants from Ethiopia |
| Minimum | 4.7% | 8.0% |
| Maximum | 38.8% | 37.1% |
| Range | 34.1% | 29.0% |
| Mean | 17.9% | 18.1% |
| Median | 17.2% | 18.1% |
| Interquartile 25% (IQ1) | 12.8% | 13.5% |
| Interquartile 75% (IQ3) | 21.7% | 21.1% |
| Interquartile Range (IQR) | 8.9% | 7.6% |
| Standard Deviation (Sample) | 6.7% | 6.4% |
| Standard Deviation (Population) | 6.7% | 6.3% |
Similar Demographics by 3 or more Vehicles in Household
Demographics Similar to Liberians by 3 or more Vehicles in Household
In terms of 3 or more vehicles in household, the demographic groups most similar to Liberians are Immigrants from Congo (17.0%, a difference of 0.15%), Immigrants from Spain (17.0%, a difference of 0.27%), Bahamian (16.9%, a difference of 0.35%), Immigrants from Western Africa (16.9%, a difference of 0.46%), and Immigrants from Russia (16.9%, a difference of 0.51%).
| Demographics | Rating | Rank | 3 or more Vehicles in Household |
| Blacks/African Americans | 0.3 /100 | #283 | Tragic 17.3% |
| Immigrants | Colombia | 0.3 /100 | #284 | Tragic 17.3% |
| Immigrants | Croatia | 0.2 /100 | #285 | Tragic 17.2% |
| Menominee | 0.2 /100 | #286 | Tragic 17.2% |
| Immigrants | Brazil | 0.2 /100 | #287 | Tragic 17.1% |
| Immigrants | Uruguay | 0.2 /100 | #288 | Tragic 17.1% |
| Immigrants | Liberia | 0.1 /100 | #289 | Tragic 17.1% |
| Liberians | 0.1 /100 | #290 | Tragic 17.0% |
| Immigrants | Congo | 0.1 /100 | #291 | Tragic 17.0% |
| Immigrants | Spain | 0.1 /100 | #292 | Tragic 17.0% |
| Bahamians | 0.1 /100 | #293 | Tragic 16.9% |
| Immigrants | Western Africa | 0.1 /100 | #294 | Tragic 16.9% |
| Immigrants | Russia | 0.1 /100 | #295 | Tragic 16.9% |
| Inupiat | 0.1 /100 | #296 | Tragic 16.9% |
| Israelis | 0.1 /100 | #297 | Tragic 16.8% |
Demographics Similar to Immigrants from Ethiopia by 3 or more Vehicles in Household
In terms of 3 or more vehicles in household, the demographic groups most similar to Immigrants from Ethiopia are Ethiopian (17.9%, a difference of 0.0%), Immigrants from Turkey (17.9%, a difference of 0.030%), Subsaharan African (17.9%, a difference of 0.19%), Immigrants from Southern Europe (17.9%, a difference of 0.21%), and Immigrants from Eritrea (17.8%, a difference of 0.23%).
| Demographics | Rating | Rank | 3 or more Vehicles in Household |
| Immigrants | Australia | 2.0 /100 | #246 | Tragic 18.1% |
| Carpatho Rusyns | 1.9 /100 | #247 | Tragic 18.0% |
| Immigrants | Eastern Africa | 1.8 /100 | #248 | Tragic 18.0% |
| Immigrants | Saudi Arabia | 1.7 /100 | #249 | Tragic 18.0% |
| Venezuelans | 1.7 /100 | #250 | Tragic 18.0% |
| Alsatians | 1.5 /100 | #251 | Tragic 18.0% |
| Immigrants | Southern Europe | 1.4 /100 | #252 | Tragic 17.9% |
| Immigrants | Ethiopia | 1.3 /100 | #253 | Tragic 17.9% |
| Ethiopians | 1.2 /100 | #254 | Tragic 17.9% |
| Immigrants | Turkey | 1.2 /100 | #255 | Tragic 17.9% |
| Sub-Saharan Africans | 1.1 /100 | #256 | Tragic 17.9% |
| Immigrants | Eritrea | 1.1 /100 | #257 | Tragic 17.8% |
| Sudanese | 1.1 /100 | #258 | Tragic 17.8% |
| Uruguayans | 1.0 /100 | #259 | Tragic 17.8% |
| Ugandans | 0.9 /100 | #260 | Tragic 17.8% |