Liberian vs Macedonian 2 or more Vehicles in Household
COMPARE
Liberian
Macedonian
2 or more Vehicles in Household
2 or more Vehicles in Household Comparison
Liberians
Macedonians
51.7%
2 OR MORE VEHICLES IN HOUSEHOLD
0.1/ 100
METRIC RATING
279th/ 347
METRIC RANK
53.3%
2 OR MORE VEHICLES IN HOUSEHOLD
2.4/ 100
METRIC RATING
237th/ 347
METRIC RANK
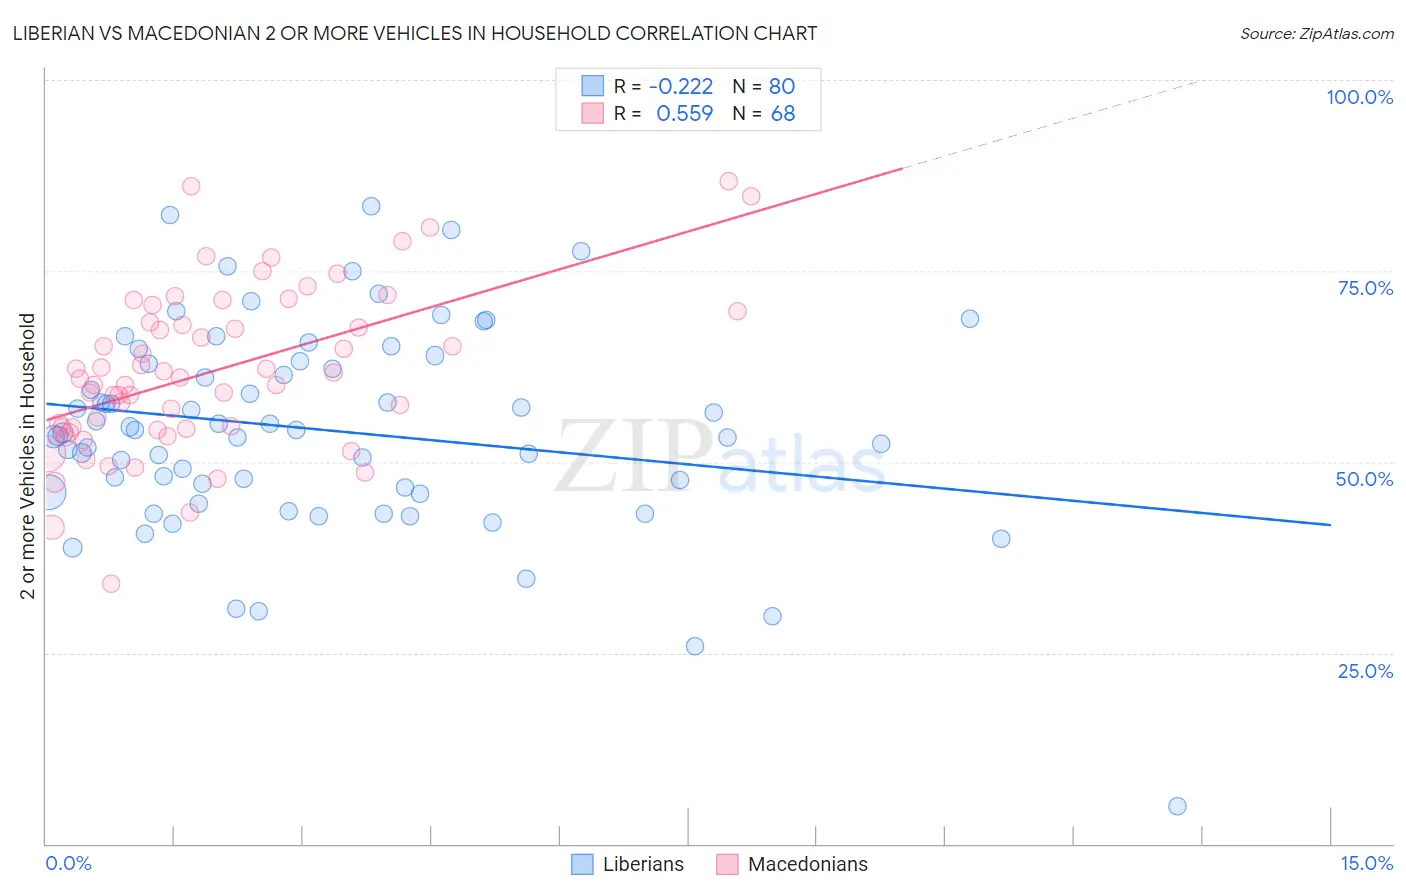
Liberian vs Macedonian 2 or more Vehicles in Household Correlation Chart
The statistical analysis conducted on geographies consisting of 118,047,251 people shows a weak negative correlation between the proportion of Liberians and percentage of households with 2 or more vehicles available in the United States with a correlation coefficient (R) of -0.222 and weighted average of 51.7%. Similarly, the statistical analysis conducted on geographies consisting of 132,543,746 people shows a substantial positive correlation between the proportion of Macedonians and percentage of households with 2 or more vehicles available in the United States with a correlation coefficient (R) of 0.559 and weighted average of 53.3%, a difference of 3.0%.
2 or more Vehicles in Household Correlation Summary
| Measurement | Liberian | Macedonian |
| Minimum | 4.9% | 34.1% |
| Maximum | 83.5% | 86.7% |
| Range | 78.6% | 52.6% |
| Mean | 54.2% | 61.9% |
| Median | 54.0% | 61.0% |
| Interquartile 25% (IQ1) | 46.3% | 54.4% |
| Interquartile 75% (IQ3) | 63.0% | 69.0% |
| Interquartile Range (IQR) | 16.7% | 14.5% |
| Standard Deviation (Sample) | 13.4% | 10.7% |
| Standard Deviation (Population) | 13.3% | 10.6% |
Similar Demographics by 2 or more Vehicles in Household
Demographics Similar to Liberians by 2 or more Vehicles in Household
In terms of 2 or more vehicles in household, the demographic groups most similar to Liberians are Yuman (51.7%, a difference of 0.010%), Immigrants from Eastern Europe (51.7%, a difference of 0.030%), Immigrants from Africa (51.8%, a difference of 0.070%), Immigrants from Croatia (51.8%, a difference of 0.13%), and Immigrants from Honduras (51.8%, a difference of 0.15%).
| Demographics | Rating | Rank | 2 or more Vehicles in Household |
| Sub-Saharan Africans | 0.2 /100 | #272 | Tragic 51.9% |
| Israelis | 0.2 /100 | #273 | Tragic 51.9% |
| Africans | 0.2 /100 | #274 | Tragic 51.8% |
| Immigrants | Honduras | 0.2 /100 | #275 | Tragic 51.8% |
| Immigrants | Croatia | 0.2 /100 | #276 | Tragic 51.8% |
| Immigrants | Africa | 0.2 /100 | #277 | Tragic 51.8% |
| Yuman | 0.1 /100 | #278 | Tragic 51.7% |
| Liberians | 0.1 /100 | #279 | Tragic 51.7% |
| Immigrants | Eastern Europe | 0.1 /100 | #280 | Tragic 51.7% |
| Immigrants | Kazakhstan | 0.1 /100 | #281 | Tragic 51.6% |
| Bahamians | 0.1 /100 | #282 | Tragic 51.5% |
| Immigrants | China | 0.1 /100 | #283 | Tragic 51.5% |
| Immigrants | Zaire | 0.1 /100 | #284 | Tragic 51.5% |
| Immigrants | Uruguay | 0.1 /100 | #285 | Tragic 51.4% |
| Immigrants | Liberia | 0.1 /100 | #286 | Tragic 51.3% |
Demographics Similar to Macedonians by 2 or more Vehicles in Household
In terms of 2 or more vehicles in household, the demographic groups most similar to Macedonians are Immigrants from Armenia (53.3%, a difference of 0.070%), Cambodian (53.3%, a difference of 0.070%), Indonesian (53.4%, a difference of 0.11%), Immigrants from Europe (53.2%, a difference of 0.14%), and Immigrants from Sierra Leone (53.2%, a difference of 0.17%).
| Demographics | Rating | Rank | 2 or more Vehicles in Household |
| Immigrants | Nepal | 3.6 /100 | #230 | Tragic 53.5% |
| Panamanians | 3.4 /100 | #231 | Tragic 53.5% |
| Immigrants | Guatemala | 3.2 /100 | #232 | Tragic 53.5% |
| Ugandans | 3.2 /100 | #233 | Tragic 53.5% |
| Immigrants | Switzerland | 3.0 /100 | #234 | Tragic 53.4% |
| Immigrants | Middle Africa | 3.0 /100 | #235 | Tragic 53.4% |
| Indonesians | 2.7 /100 | #236 | Tragic 53.4% |
| Macedonians | 2.4 /100 | #237 | Tragic 53.3% |
| Immigrants | Armenia | 2.3 /100 | #238 | Tragic 53.3% |
| Cambodians | 2.3 /100 | #239 | Tragic 53.3% |
| Immigrants | Europe | 2.1 /100 | #240 | Tragic 53.2% |
| Immigrants | Sierra Leone | 2.1 /100 | #241 | Tragic 53.2% |
| Immigrants | Eastern Asia | 2.1 /100 | #242 | Tragic 53.2% |
| Ethiopians | 1.7 /100 | #243 | Tragic 53.1% |
| Indians (Asian) | 1.7 /100 | #244 | Tragic 53.1% |