Immigrants from Somalia vs Macedonian 2 or more Vehicles in Household
COMPARE
Immigrants from Somalia
Macedonian
2 or more Vehicles in Household
2 or more Vehicles in Household Comparison
Immigrants from Somalia
Macedonians
50.5%
2 OR MORE VEHICLES IN HOUSEHOLD
0.0/ 100
METRIC RATING
296th/ 347
METRIC RANK
53.3%
2 OR MORE VEHICLES IN HOUSEHOLD
2.4/ 100
METRIC RATING
237th/ 347
METRIC RANK
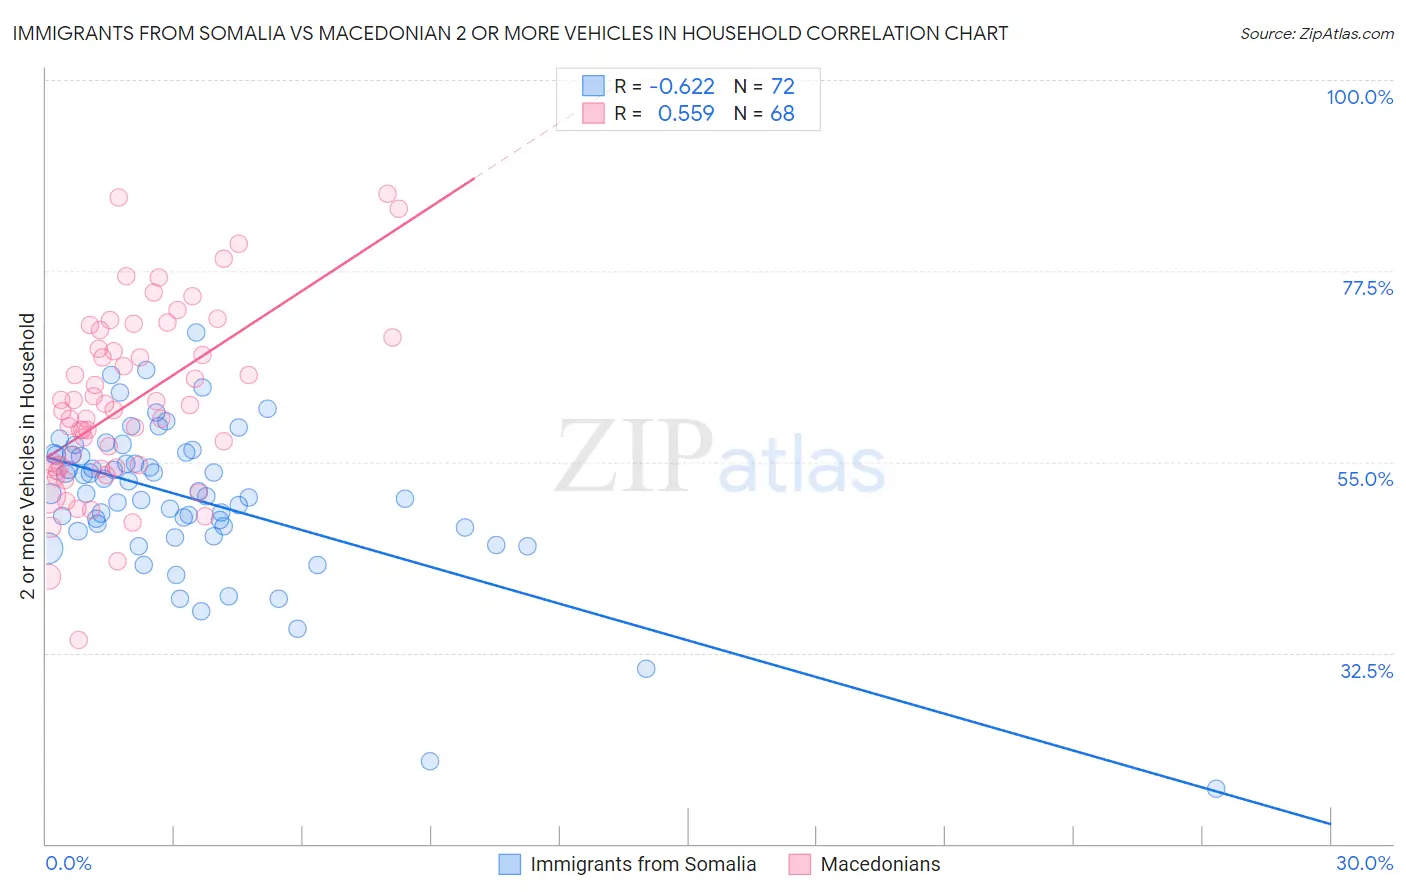
Immigrants from Somalia vs Macedonian 2 or more Vehicles in Household Correlation Chart
The statistical analysis conducted on geographies consisting of 92,099,501 people shows a significant negative correlation between the proportion of Immigrants from Somalia and percentage of households with 2 or more vehicles available in the United States with a correlation coefficient (R) of -0.622 and weighted average of 50.5%. Similarly, the statistical analysis conducted on geographies consisting of 132,543,746 people shows a substantial positive correlation between the proportion of Macedonians and percentage of households with 2 or more vehicles available in the United States with a correlation coefficient (R) of 0.559 and weighted average of 53.3%, a difference of 5.5%.
2 or more Vehicles in Household Correlation Summary
| Measurement | Immigrants from Somalia | Macedonian |
| Minimum | 16.4% | 34.1% |
| Maximum | 70.3% | 86.7% |
| Range | 53.8% | 52.6% |
| Mean | 50.6% | 61.9% |
| Median | 51.2% | 61.0% |
| Interquartile 25% (IQ1) | 47.1% | 54.4% |
| Interquartile 75% (IQ3) | 55.9% | 69.0% |
| Interquartile Range (IQR) | 8.8% | 14.5% |
| Standard Deviation (Sample) | 9.2% | 10.7% |
| Standard Deviation (Population) | 9.1% | 10.6% |
Similar Demographics by 2 or more Vehicles in Household
Demographics Similar to Immigrants from Somalia by 2 or more Vehicles in Household
In terms of 2 or more vehicles in household, the demographic groups most similar to Immigrants from Somalia are Cypriot (50.6%, a difference of 0.040%), Bermudan (50.6%, a difference of 0.11%), Immigrants from Spain (50.4%, a difference of 0.27%), Paraguayan (50.3%, a difference of 0.40%), and Immigrants from Morocco (50.3%, a difference of 0.43%).
| Demographics | Rating | Rank | 2 or more Vehicles in Household |
| Somalis | 0.0 /100 | #289 | Tragic 51.1% |
| Immigrants | Panama | 0.0 /100 | #290 | Tragic 51.1% |
| Belizeans | 0.0 /100 | #291 | Tragic 51.0% |
| Immigrants | Ukraine | 0.0 /100 | #292 | Tragic 50.9% |
| Blacks/African Americans | 0.0 /100 | #293 | Tragic 50.9% |
| Bermudans | 0.0 /100 | #294 | Tragic 50.6% |
| Cypriots | 0.0 /100 | #295 | Tragic 50.6% |
| Immigrants | Somalia | 0.0 /100 | #296 | Tragic 50.5% |
| Immigrants | Spain | 0.0 /100 | #297 | Tragic 50.4% |
| Paraguayans | 0.0 /100 | #298 | Tragic 50.3% |
| Immigrants | Morocco | 0.0 /100 | #299 | Tragic 50.3% |
| Immigrants | Russia | 0.0 /100 | #300 | Tragic 50.3% |
| Immigrants | Greece | 0.0 /100 | #301 | Tragic 50.2% |
| Immigrants | South America | 0.0 /100 | #302 | Tragic 50.2% |
| Tohono O'odham | 0.0 /100 | #303 | Tragic 50.0% |
Demographics Similar to Macedonians by 2 or more Vehicles in Household
In terms of 2 or more vehicles in household, the demographic groups most similar to Macedonians are Immigrants from Armenia (53.3%, a difference of 0.070%), Cambodian (53.3%, a difference of 0.070%), Indonesian (53.4%, a difference of 0.11%), Immigrants from Europe (53.2%, a difference of 0.14%), and Immigrants from Sierra Leone (53.2%, a difference of 0.17%).
| Demographics | Rating | Rank | 2 or more Vehicles in Household |
| Immigrants | Nepal | 3.6 /100 | #230 | Tragic 53.5% |
| Panamanians | 3.4 /100 | #231 | Tragic 53.5% |
| Immigrants | Guatemala | 3.2 /100 | #232 | Tragic 53.5% |
| Ugandans | 3.2 /100 | #233 | Tragic 53.5% |
| Immigrants | Switzerland | 3.0 /100 | #234 | Tragic 53.4% |
| Immigrants | Middle Africa | 3.0 /100 | #235 | Tragic 53.4% |
| Indonesians | 2.7 /100 | #236 | Tragic 53.4% |
| Macedonians | 2.4 /100 | #237 | Tragic 53.3% |
| Immigrants | Armenia | 2.3 /100 | #238 | Tragic 53.3% |
| Cambodians | 2.3 /100 | #239 | Tragic 53.3% |
| Immigrants | Europe | 2.1 /100 | #240 | Tragic 53.2% |
| Immigrants | Sierra Leone | 2.1 /100 | #241 | Tragic 53.2% |
| Immigrants | Eastern Asia | 2.1 /100 | #242 | Tragic 53.2% |
| Ethiopians | 1.7 /100 | #243 | Tragic 53.1% |
| Indians (Asian) | 1.7 /100 | #244 | Tragic 53.1% |