Liberian vs Costa Rican 2 or more Vehicles in Household
COMPARE
Liberian
Costa Rican
2 or more Vehicles in Household
2 or more Vehicles in Household Comparison
Liberians
Costa Ricans
51.7%
2 OR MORE VEHICLES IN HOUSEHOLD
0.1/ 100
METRIC RATING
279th/ 347
METRIC RANK
56.9%
2 OR MORE VEHICLES IN HOUSEHOLD
94.7/ 100
METRIC RATING
120th/ 347
METRIC RANK
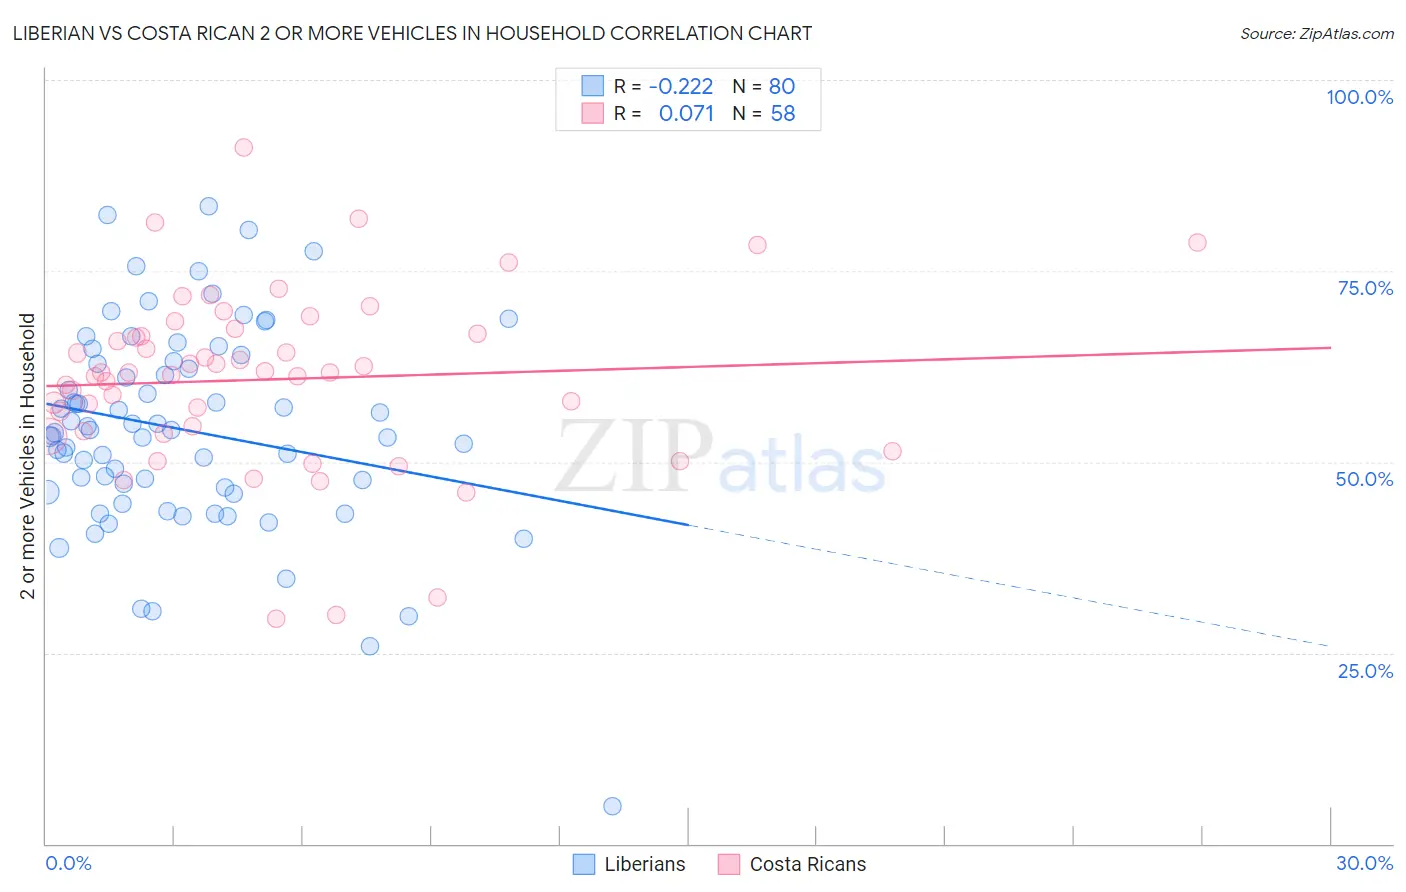
Liberian vs Costa Rican 2 or more Vehicles in Household Correlation Chart
The statistical analysis conducted on geographies consisting of 118,047,251 people shows a weak negative correlation between the proportion of Liberians and percentage of households with 2 or more vehicles available in the United States with a correlation coefficient (R) of -0.222 and weighted average of 51.7%. Similarly, the statistical analysis conducted on geographies consisting of 253,480,816 people shows a slight positive correlation between the proportion of Costa Ricans and percentage of households with 2 or more vehicles available in the United States with a correlation coefficient (R) of 0.071 and weighted average of 56.9%, a difference of 10.0%.
2 or more Vehicles in Household Correlation Summary
| Measurement | Liberian | Costa Rican |
| Minimum | 4.9% | 29.5% |
| Maximum | 83.5% | 91.2% |
| Range | 78.6% | 61.7% |
| Mean | 54.2% | 60.8% |
| Median | 54.0% | 61.7% |
| Interquartile 25% (IQ1) | 46.3% | 54.0% |
| Interquartile 75% (IQ3) | 63.0% | 66.8% |
| Interquartile Range (IQR) | 16.7% | 12.8% |
| Standard Deviation (Sample) | 13.4% | 11.7% |
| Standard Deviation (Population) | 13.3% | 11.6% |
Similar Demographics by 2 or more Vehicles in Household
Demographics Similar to Liberians by 2 or more Vehicles in Household
In terms of 2 or more vehicles in household, the demographic groups most similar to Liberians are Yuman (51.7%, a difference of 0.010%), Immigrants from Eastern Europe (51.7%, a difference of 0.030%), Immigrants from Africa (51.8%, a difference of 0.070%), Immigrants from Croatia (51.8%, a difference of 0.13%), and Immigrants from Honduras (51.8%, a difference of 0.15%).
| Demographics | Rating | Rank | 2 or more Vehicles in Household |
| Sub-Saharan Africans | 0.2 /100 | #272 | Tragic 51.9% |
| Israelis | 0.2 /100 | #273 | Tragic 51.9% |
| Africans | 0.2 /100 | #274 | Tragic 51.8% |
| Immigrants | Honduras | 0.2 /100 | #275 | Tragic 51.8% |
| Immigrants | Croatia | 0.2 /100 | #276 | Tragic 51.8% |
| Immigrants | Africa | 0.2 /100 | #277 | Tragic 51.8% |
| Yuman | 0.1 /100 | #278 | Tragic 51.7% |
| Liberians | 0.1 /100 | #279 | Tragic 51.7% |
| Immigrants | Eastern Europe | 0.1 /100 | #280 | Tragic 51.7% |
| Immigrants | Kazakhstan | 0.1 /100 | #281 | Tragic 51.6% |
| Bahamians | 0.1 /100 | #282 | Tragic 51.5% |
| Immigrants | China | 0.1 /100 | #283 | Tragic 51.5% |
| Immigrants | Zaire | 0.1 /100 | #284 | Tragic 51.5% |
| Immigrants | Uruguay | 0.1 /100 | #285 | Tragic 51.4% |
| Immigrants | Liberia | 0.1 /100 | #286 | Tragic 51.3% |
Demographics Similar to Costa Ricans by 2 or more Vehicles in Household
In terms of 2 or more vehicles in household, the demographic groups most similar to Costa Ricans are Native/Alaskan (57.0%, a difference of 0.050%), Asian (57.0%, a difference of 0.070%), Sioux (56.8%, a difference of 0.17%), Iraqi (57.1%, a difference of 0.24%), and Immigrants from South Africa (56.7%, a difference of 0.37%).
| Demographics | Rating | Rank | 2 or more Vehicles in Household |
| Zimbabweans | 96.9 /100 | #113 | Exceptional 57.2% |
| Immigrants | Lebanon | 96.8 /100 | #114 | Exceptional 57.2% |
| Chippewa | 96.6 /100 | #115 | Exceptional 57.2% |
| Immigrants | Jordan | 96.6 /100 | #116 | Exceptional 57.2% |
| Iraqis | 95.8 /100 | #117 | Exceptional 57.1% |
| Asians | 95.1 /100 | #118 | Exceptional 57.0% |
| Natives/Alaskans | 95.0 /100 | #119 | Exceptional 57.0% |
| Costa Ricans | 94.7 /100 | #120 | Exceptional 56.9% |
| Sioux | 93.8 /100 | #121 | Exceptional 56.8% |
| Immigrants | South Africa | 92.5 /100 | #122 | Exceptional 56.7% |
| Australians | 91.8 /100 | #123 | Exceptional 56.7% |
| New Zealanders | 91.8 /100 | #124 | Exceptional 56.7% |
| Tsimshian | 91.6 /100 | #125 | Exceptional 56.7% |
| Estonians | 90.9 /100 | #126 | Exceptional 56.6% |
| Immigrants | Thailand | 90.7 /100 | #127 | Exceptional 56.6% |