Liberian vs Macedonian High School Diploma
COMPARE
Liberian
Macedonian
High School Diploma
High School Diploma Comparison
Liberians
Macedonians
88.7%
HIGH SCHOOL DIPLOMA
18.8/ 100
METRIC RATING
198th/ 347
METRIC RANK
91.1%
HIGH SCHOOL DIPLOMA
99.7/ 100
METRIC RATING
54th/ 347
METRIC RANK
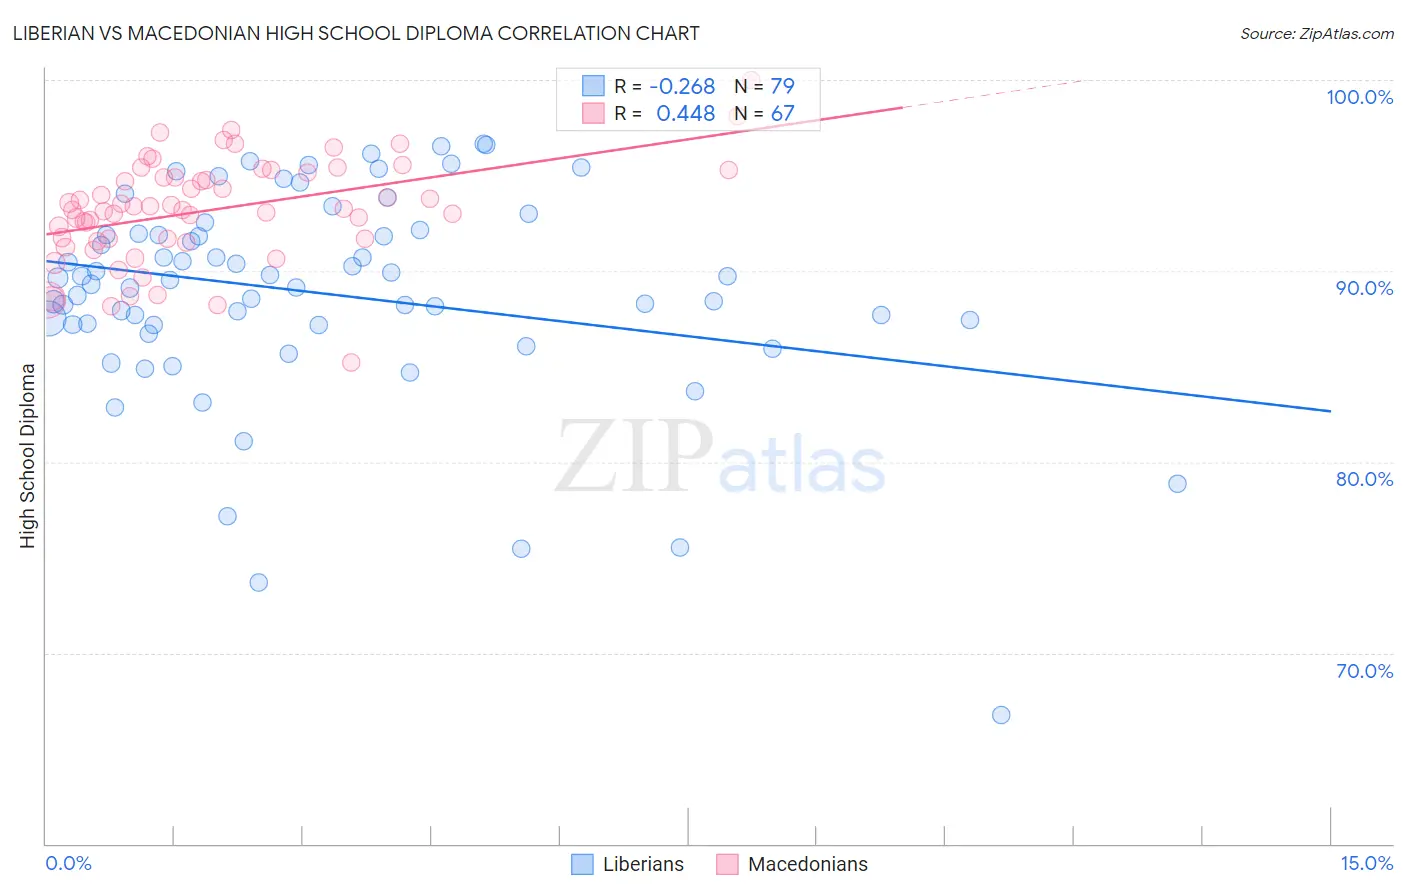
Liberian vs Macedonian High School Diploma Correlation Chart
The statistical analysis conducted on geographies consisting of 118,101,728 people shows a weak negative correlation between the proportion of Liberians and percentage of population with at least high school diploma education in the United States with a correlation coefficient (R) of -0.268 and weighted average of 88.7%. Similarly, the statistical analysis conducted on geographies consisting of 132,645,902 people shows a moderate positive correlation between the proportion of Macedonians and percentage of population with at least high school diploma education in the United States with a correlation coefficient (R) of 0.448 and weighted average of 91.1%, a difference of 2.8%.
High School Diploma Correlation Summary
| Measurement | Liberian | Macedonian |
| Minimum | 66.8% | 85.2% |
| Maximum | 96.6% | 100.0% |
| Range | 29.9% | 14.8% |
| Mean | 88.8% | 93.2% |
| Median | 89.5% | 93.3% |
| Interquartile 25% (IQ1) | 87.2% | 91.7% |
| Interquartile 75% (IQ3) | 91.9% | 95.1% |
| Interquartile Range (IQR) | 4.8% | 3.5% |
| Standard Deviation (Sample) | 5.5% | 2.7% |
| Standard Deviation (Population) | 5.5% | 2.7% |
Similar Demographics by High School Diploma
Demographics Similar to Liberians by High School Diploma
In terms of high school diploma, the demographic groups most similar to Liberians are Marshallese (88.6%, a difference of 0.0%), Hawaiian (88.6%, a difference of 0.010%), Korean (88.6%, a difference of 0.020%), Panamanian (88.6%, a difference of 0.020%), and Somali (88.6%, a difference of 0.030%).
| Demographics | Rating | Rank | High School Diploma |
| Immigrants | Ethiopia | 30.9 /100 | #191 | Fair 88.9% |
| Moroccans | 29.5 /100 | #192 | Fair 88.8% |
| Immigrants | Oceania | 26.9 /100 | #193 | Fair 88.8% |
| Immigrants | Venezuela | 25.8 /100 | #194 | Fair 88.8% |
| Afghans | 23.9 /100 | #195 | Fair 88.8% |
| Immigrants | Southern Europe | 23.4 /100 | #196 | Fair 88.7% |
| French American Indians | 21.5 /100 | #197 | Fair 88.7% |
| Liberians | 18.8 /100 | #198 | Poor 88.7% |
| Marshallese | 18.7 /100 | #199 | Poor 88.6% |
| Hawaiians | 18.3 /100 | #200 | Poor 88.6% |
| Koreans | 18.1 /100 | #201 | Poor 88.6% |
| Panamanians | 18.0 /100 | #202 | Poor 88.6% |
| Somalis | 17.5 /100 | #203 | Poor 88.6% |
| Armenians | 17.2 /100 | #204 | Poor 88.6% |
| Immigrants | Micronesia | 16.4 /100 | #205 | Poor 88.6% |
Demographics Similar to Macedonians by High School Diploma
In terms of high school diploma, the demographic groups most similar to Macedonians are Serbian (91.1%, a difference of 0.010%), New Zealander (91.1%, a difference of 0.020%), Immigrants from Sweden (91.1%, a difference of 0.020%), Immigrants from Belgium (91.1%, a difference of 0.020%), and Immigrants from Canada (91.1%, a difference of 0.040%).
| Demographics | Rating | Rank | High School Diploma |
| Australians | 99.8 /100 | #47 | Exceptional 91.2% |
| Belgians | 99.8 /100 | #48 | Exceptional 91.2% |
| Bhutanese | 99.8 /100 | #49 | Exceptional 91.2% |
| Welsh | 99.8 /100 | #50 | Exceptional 91.2% |
| New Zealanders | 99.7 /100 | #51 | Exceptional 91.1% |
| Immigrants | Sweden | 99.7 /100 | #52 | Exceptional 91.1% |
| Immigrants | Belgium | 99.7 /100 | #53 | Exceptional 91.1% |
| Macedonians | 99.7 /100 | #54 | Exceptional 91.1% |
| Serbians | 99.7 /100 | #55 | Exceptional 91.1% |
| Immigrants | Canada | 99.7 /100 | #56 | Exceptional 91.1% |
| Zimbabweans | 99.7 /100 | #57 | Exceptional 91.1% |
| Slavs | 99.7 /100 | #58 | Exceptional 91.0% |
| Immigrants | North America | 99.7 /100 | #59 | Exceptional 91.0% |
| Immigrants | Japan | 99.6 /100 | #60 | Exceptional 91.0% |
| Immigrants | Taiwan | 99.6 /100 | #61 | Exceptional 91.0% |