Immigrants from Poland vs Macedonian 2 or more Vehicles in Household
COMPARE
Immigrants from Poland
Macedonian
2 or more Vehicles in Household
2 or more Vehicles in Household Comparison
Immigrants from Poland
Macedonians
54.6%
2 OR MORE VEHICLES IN HOUSEHOLD
19.3/ 100
METRIC RATING
196th/ 347
METRIC RANK
53.3%
2 OR MORE VEHICLES IN HOUSEHOLD
2.4/ 100
METRIC RATING
237th/ 347
METRIC RANK
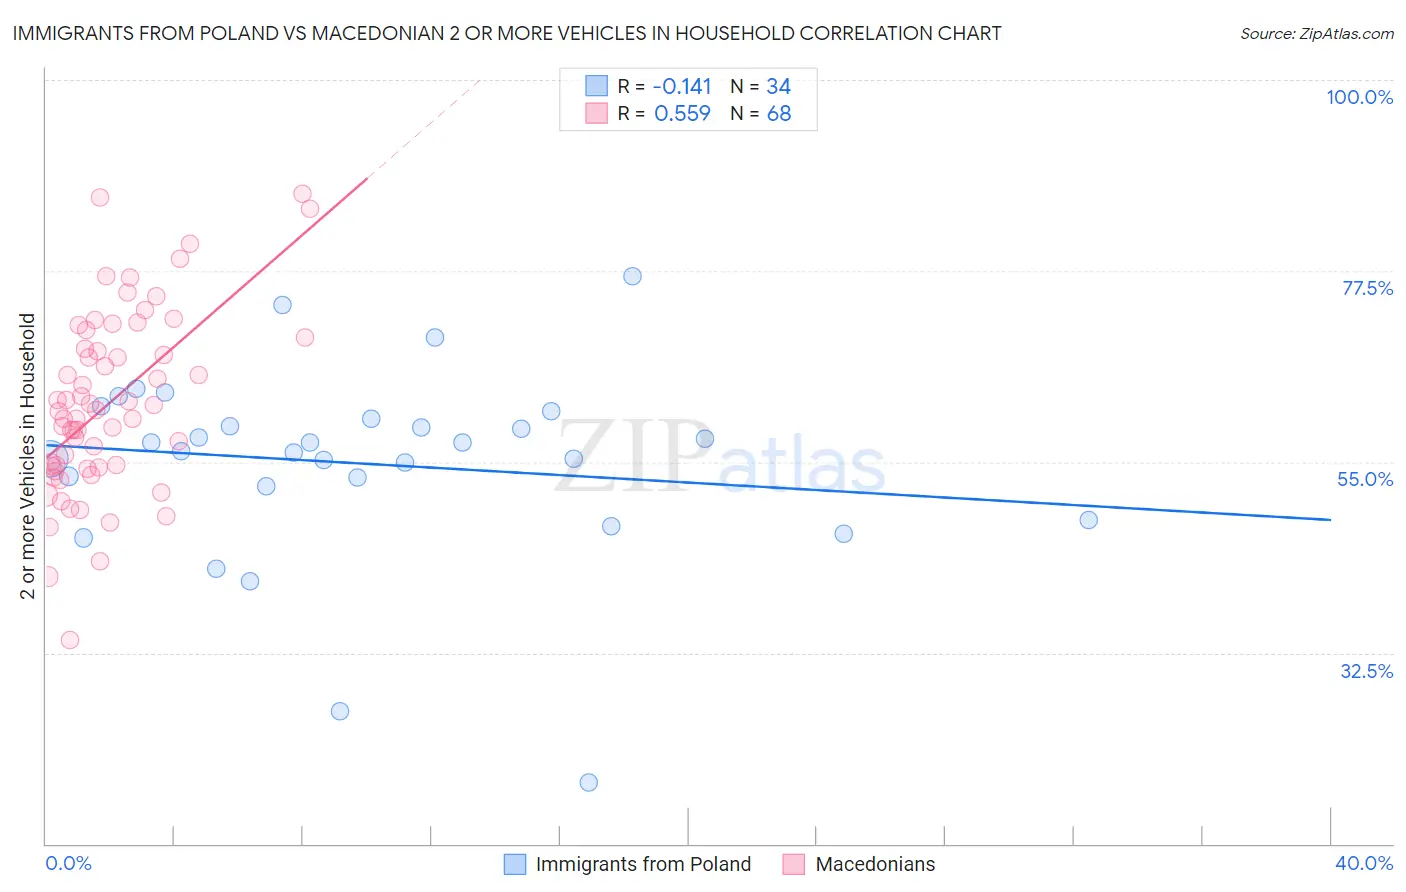
Immigrants from Poland vs Macedonian 2 or more Vehicles in Household Correlation Chart
The statistical analysis conducted on geographies consisting of 304,779,004 people shows a poor negative correlation between the proportion of Immigrants from Poland and percentage of households with 2 or more vehicles available in the United States with a correlation coefficient (R) of -0.141 and weighted average of 54.6%. Similarly, the statistical analysis conducted on geographies consisting of 132,543,746 people shows a substantial positive correlation between the proportion of Macedonians and percentage of households with 2 or more vehicles available in the United States with a correlation coefficient (R) of 0.559 and weighted average of 53.3%, a difference of 2.3%.
2 or more Vehicles in Household Correlation Summary
| Measurement | Immigrants from Poland | Macedonian |
| Minimum | 17.2% | 34.1% |
| Maximum | 76.9% | 86.7% |
| Range | 59.6% | 52.6% |
| Mean | 54.8% | 61.9% |
| Median | 56.7% | 61.0% |
| Interquartile 25% (IQ1) | 52.2% | 54.4% |
| Interquartile 75% (IQ3) | 60.1% | 69.0% |
| Interquartile Range (IQR) | 8.0% | 14.5% |
| Standard Deviation (Sample) | 11.5% | 10.7% |
| Standard Deviation (Population) | 11.3% | 10.6% |
Similar Demographics by 2 or more Vehicles in Household
Demographics Similar to Immigrants from Poland by 2 or more Vehicles in Household
In terms of 2 or more vehicles in household, the demographic groups most similar to Immigrants from Poland are Argentinean (54.5%, a difference of 0.12%), Iroquois (54.7%, a difference of 0.20%), Carpatho Rusyn (54.4%, a difference of 0.21%), Central American (54.7%, a difference of 0.22%), and Immigrants from Norway (54.4%, a difference of 0.24%).
| Demographics | Rating | Rank | 2 or more Vehicles in Household |
| Eastern Europeans | 27.5 /100 | #189 | Fair 54.8% |
| Russians | 26.3 /100 | #190 | Fair 54.8% |
| Immigrants | Immigrants | 25.0 /100 | #191 | Fair 54.7% |
| Immigrants | Romania | 23.8 /100 | #192 | Fair 54.7% |
| Immigrants | Japan | 23.4 /100 | #193 | Fair 54.7% |
| Central Americans | 23.0 /100 | #194 | Fair 54.7% |
| Iroquois | 22.6 /100 | #195 | Fair 54.7% |
| Immigrants | Poland | 19.3 /100 | #196 | Poor 54.6% |
| Argentineans | 17.5 /100 | #197 | Poor 54.5% |
| Carpatho Rusyns | 16.2 /100 | #198 | Poor 54.4% |
| Immigrants | Norway | 15.9 /100 | #199 | Poor 54.4% |
| Houma | 15.8 /100 | #200 | Poor 54.4% |
| Immigrants | Italy | 15.5 /100 | #201 | Poor 54.4% |
| Immigrants | North Macedonia | 14.9 /100 | #202 | Poor 54.4% |
| Immigrants | Peru | 14.3 /100 | #203 | Poor 54.4% |
Demographics Similar to Macedonians by 2 or more Vehicles in Household
In terms of 2 or more vehicles in household, the demographic groups most similar to Macedonians are Immigrants from Armenia (53.3%, a difference of 0.070%), Cambodian (53.3%, a difference of 0.070%), Indonesian (53.4%, a difference of 0.11%), Immigrants from Europe (53.2%, a difference of 0.14%), and Immigrants from Sierra Leone (53.2%, a difference of 0.17%).
| Demographics | Rating | Rank | 2 or more Vehicles in Household |
| Immigrants | Nepal | 3.6 /100 | #230 | Tragic 53.5% |
| Panamanians | 3.4 /100 | #231 | Tragic 53.5% |
| Immigrants | Guatemala | 3.2 /100 | #232 | Tragic 53.5% |
| Ugandans | 3.2 /100 | #233 | Tragic 53.5% |
| Immigrants | Switzerland | 3.0 /100 | #234 | Tragic 53.4% |
| Immigrants | Middle Africa | 3.0 /100 | #235 | Tragic 53.4% |
| Indonesians | 2.7 /100 | #236 | Tragic 53.4% |
| Macedonians | 2.4 /100 | #237 | Tragic 53.3% |
| Immigrants | Armenia | 2.3 /100 | #238 | Tragic 53.3% |
| Cambodians | 2.3 /100 | #239 | Tragic 53.3% |
| Immigrants | Europe | 2.1 /100 | #240 | Tragic 53.2% |
| Immigrants | Sierra Leone | 2.1 /100 | #241 | Tragic 53.2% |
| Immigrants | Eastern Asia | 2.1 /100 | #242 | Tragic 53.2% |
| Ethiopians | 1.7 /100 | #243 | Tragic 53.1% |
| Indians (Asian) | 1.7 /100 | #244 | Tragic 53.1% |