Indonesian vs Immigrants from Nigeria 3 or more Vehicles in Household
COMPARE
Indonesian
Immigrants from Nigeria
3 or more Vehicles in Household
3 or more Vehicles in Household Comparison
Indonesians
Immigrants from Nigeria
18.3%
3 OR MORE VEHICLES IN HOUSEHOLD
3.5/ 100
METRIC RATING
237th/ 347
METRIC RANK
18.7%
3 OR MORE VEHICLES IN HOUSEHOLD
10.3/ 100
METRIC RATING
216th/ 347
METRIC RANK
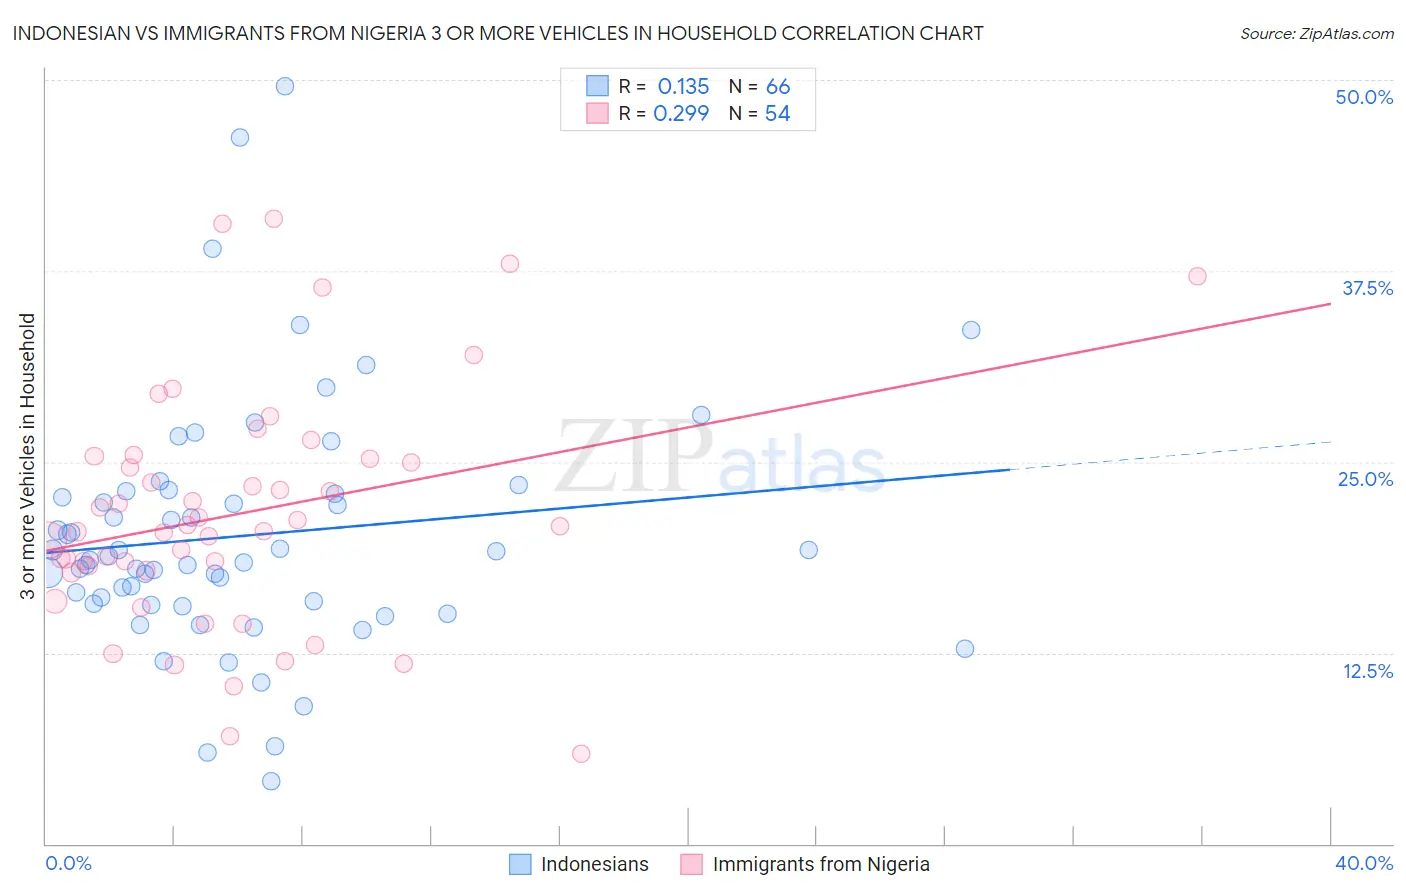
Indonesian vs Immigrants from Nigeria 3 or more Vehicles in Household Correlation Chart
The statistical analysis conducted on geographies consisting of 162,622,478 people shows a poor positive correlation between the proportion of Indonesians and percentage of households with 3 or more vehicles available in the United States with a correlation coefficient (R) of 0.135 and weighted average of 18.3%. Similarly, the statistical analysis conducted on geographies consisting of 283,187,528 people shows a weak positive correlation between the proportion of Immigrants from Nigeria and percentage of households with 3 or more vehicles available in the United States with a correlation coefficient (R) of 0.299 and weighted average of 18.7%, a difference of 2.3%.
3 or more Vehicles in Household Correlation Summary
| Measurement | Indonesian | Immigrants from Nigeria |
| Minimum | 4.1% | 5.9% |
| Maximum | 49.6% | 40.9% |
| Range | 45.5% | 35.0% |
| Mean | 20.2% | 21.6% |
| Median | 18.7% | 20.6% |
| Interquartile 25% (IQ1) | 15.7% | 17.9% |
| Interquartile 75% (IQ3) | 22.9% | 25.2% |
| Interquartile Range (IQR) | 7.2% | 7.3% |
| Standard Deviation (Sample) | 8.1% | 7.8% |
| Standard Deviation (Population) | 8.0% | 7.7% |
Similar Demographics by 3 or more Vehicles in Household
Demographics Similar to Indonesians by 3 or more Vehicles in Household
In terms of 3 or more vehicles in household, the demographic groups most similar to Indonesians are Immigrants from Malaysia (18.3%, a difference of 0.040%), Sierra Leonean (18.3%, a difference of 0.23%), Immigrants from Honduras (18.2%, a difference of 0.23%), Immigrants from Middle Africa (18.2%, a difference of 0.24%), and Immigrants from China (18.2%, a difference of 0.36%).
| Demographics | Rating | Rank | 3 or more Vehicles in Household |
| Immigrants | Western Asia | 4.8 /100 | #230 | Tragic 18.4% |
| Immigrants | Belgium | 4.8 /100 | #231 | Tragic 18.4% |
| Immigrants | Uganda | 4.6 /100 | #232 | Tragic 18.4% |
| Hondurans | 4.6 /100 | #233 | Tragic 18.4% |
| Immigrants | North Macedonia | 4.4 /100 | #234 | Tragic 18.4% |
| Sierra Leoneans | 3.9 /100 | #235 | Tragic 18.3% |
| Immigrants | Malaysia | 3.6 /100 | #236 | Tragic 18.3% |
| Indonesians | 3.5 /100 | #237 | Tragic 18.3% |
| Immigrants | Honduras | 3.1 /100 | #238 | Tragic 18.2% |
| Immigrants | Middle Africa | 3.1 /100 | #239 | Tragic 18.2% |
| Immigrants | China | 2.9 /100 | #240 | Tragic 18.2% |
| Africans | 2.7 /100 | #241 | Tragic 18.2% |
| Hopi | 2.5 /100 | #242 | Tragic 18.2% |
| Immigrants | Europe | 2.4 /100 | #243 | Tragic 18.1% |
| Mongolians | 2.3 /100 | #244 | Tragic 18.1% |
Demographics Similar to Immigrants from Nigeria by 3 or more Vehicles in Household
In terms of 3 or more vehicles in household, the demographic groups most similar to Immigrants from Nigeria are Immigrants from Italy (18.7%, a difference of 0.020%), Eastern European (18.7%, a difference of 0.060%), Immigrants from Sierra Leone (18.7%, a difference of 0.10%), Panamanian (18.8%, a difference of 0.26%), and Immigrants from Cuba (18.8%, a difference of 0.26%).
| Demographics | Rating | Rank | 3 or more Vehicles in Household |
| Immigrants | Egypt | 13.5 /100 | #209 | Poor 18.8% |
| Bulgarians | 13.1 /100 | #210 | Poor 18.8% |
| Immigrants | Kenya | 12.4 /100 | #211 | Poor 18.8% |
| Panamanians | 11.6 /100 | #212 | Poor 18.8% |
| Immigrants | Cuba | 11.6 /100 | #213 | Poor 18.8% |
| Immigrants | Sierra Leone | 10.8 /100 | #214 | Poor 18.7% |
| Eastern Europeans | 10.6 /100 | #215 | Poor 18.7% |
| Immigrants | Nigeria | 10.3 /100 | #216 | Poor 18.7% |
| Immigrants | Italy | 10.2 /100 | #217 | Poor 18.7% |
| Immigrants | Portugal | 8.9 /100 | #218 | Tragic 18.6% |
| Immigrants | Armenia | 8.6 /100 | #219 | Tragic 18.6% |
| Nigerians | 7.9 /100 | #220 | Tragic 18.6% |
| Immigrants | Poland | 7.5 /100 | #221 | Tragic 18.6% |
| Belizeans | 7.3 /100 | #222 | Tragic 18.6% |
| Immigrants | Czechoslovakia | 5.9 /100 | #223 | Tragic 18.5% |